# Using the WebUI

The VoxelSpace platform provides a powerful **Web User Interface (WebUI)** that allows team members to collaborate and interact with projects directly from their browser. Key capabilities include:

- Creating and managing spatial projects
- Assigning teams to specific projects or tasks
- Uploading, organizing, and processing spatial datasets
- Building rich 3D visualizations and sharing them across teams
- Creating and executing reports and analytical processes

The WebUI is designed to make project management, data integration, and collaboration efficient and intuitive—all in one centralized platform

# Working with Projects

In VoxelSpace, Projects are the central containers used to organize spatial data, collaborative workflows, and visualization tools. Each project can include datasets, views, reports, and processing scripts, making it the foundation for team-based work and long-term data management.

After the project is created, you need to upload the Raw Data of project using Add Object.

Once the Raw Data is associated to the project you need to process that data to generate an output (view or Unity Project).

# Introduction

## Working with Projects

<span class="rvts6">  
</span>

The VoxelSpace platform uses a **data-centric approach** to help organizations scale the spatial understanding of their operations.

At the core of this approach is a **shared repository of spatial data objects**, known within the platform as **Entities**. These Entities represent a wide range of geospatial and design data types, including:

<div class="main-content" id="bkmrk-point-clouds-terrain">- <span class="rvts6">Point Clouds</span>
- <span class="rvts6">Terrain Models</span>
- <span class="rvts6">Block Models</span>
- <span class="rvts6">Planning / Design Solids</span>
- <span class="rvts6">BIM <span style="font-size: 12.0pt; font-family: 'Times New Roman',serif; mso-fareast-font-family: Calibri; mso-fareast-theme-font: minor-latin; mso-ansi-language: EN-CA; mso-fareast-language: EN-CA; mso-bidi-language: AR-SA;">(Building Information Models)</span></span>

</div>Entities can be shared across different teams within the organization—subject to security and access controls.

Most organizations generate **thousands of Entities annually**. These may include datasets captured from the field, models created by internal teams, or results generated through automated spatial processing. The full collection of these assets forms the organization’s **Catalog**.

## <span style="mso-fareast-font-family: 'Times New Roman';">Project Structure and Organization</span>

To manage large volumes of Entities, the platform organizes the Catalog into a hierarchy of **Projects** and **Folders**.

<span style="font-size: 10.0pt; mso-bidi-font-size: 12.0pt; font-family: Symbol; mso-fareast-font-family: Symbol; mso-bidi-font-family: Symbol;"><span style="mso-list: Ignore;">·<span style="font: 7.0pt 'Times New Roman';"> </span></span></span>**Projects** serve as containers for related Entities, workflows, and team collaboration.

<span style="font-size: 10.0pt; mso-bidi-font-size: 12.0pt; font-family: Symbol; mso-fareast-font-family: Symbol; mso-bidi-font-family: Symbol;"><span style="mso-list: Ignore;">·<span style="font: 7.0pt 'Times New Roman';"> </span></span></span>Each project can have its own **custom folder structure**, defined by the project team.

<span style="font-size: 10.0pt; mso-bidi-font-size: 12.0pt; font-family: Symbol; mso-fareast-font-family: Symbol; mso-bidi-font-family: Symbol;"><span style="mso-list: Ignore;">·<span style="font: 7.0pt 'Times New Roman';"> </span></span></span>**Access permissions**, folder layouts, and the selection of Entities within each project are configurable by the organization’s users.

After logging in, users can navigate to the **“Catalog”** section in the left-hand menu to see a list of accessible Projects.

[![image.png](https://help.mystart.com/uploads/images/gallery/2025-03/scaled-1680-/Qkpimage.png)](https://help.mystart.com/uploads/images/gallery/2025-03/Qkpimage.png)

Clicking on a Project will open its workspace. This loads the **Project Catalog**, where users can browse and interact with the folder structure and associated Entities.

[![image.png](https://help.mystart.com/uploads/images/gallery/2025-03/scaled-1680-/pPSimage.png)](https://help.mystart.com/uploads/images/gallery/2025-03/pPSimage.png)

Users can organize the catalog by creating folders using the **“New Folder”** button. This helps maintain clarity and structure as more Entities are added to the project.

# Creating a Project

To create a new Project in VoxelSpace, start by navigating to the **“Catalog”** section from the left-hand menu. This will display a list of all projects currently assigned to your user account.

Next, click the **“New Project”** button, located at the top of the project list:

[![image.png](https://help.mystart.com/uploads/images/gallery/2025-03/scaled-1680-/Uwgimage.png)](https://help.mystart.com/uploads/images/gallery/2025-03/Uwgimage.png)

A dialog window will appear, prompting you to enter information about the new Project:

[![image.png](https://help.mystart.com/uploads/images/gallery/2025-03/scaled-1680-/TLuimage.png)](https://help.mystart.com/uploads/images/gallery/2025-03/TLuimage.png)

<span class="rvts6">In this dialog, provide:</span>

- <span style="font-size: 10.0pt; mso-bidi-font-size: 12.0pt; font-family: Symbol; mso-fareast-font-family: Symbol; mso-bidi-font-family: Symbol;"><span style="mso-list: Ignore;"><span style="font: 7.0pt 'Times New Roman';"> </span></span></span>A **Project Name**
- <span style="font-size: 10.0pt; mso-bidi-font-size: 12.0pt; font-family: Symbol; mso-fareast-font-family: Symbol; mso-bidi-font-family: Symbol;"><span style="mso-list: Ignore;"><span style="font: 7.0pt 'Times New Roman';"> </span></span></span>An optional **Description**

Below these fields, you’ll find settings for the **Project’s Coordinate System**. These define how spatial data will be aligned and interpreted within the project. For more details, refer to the **Project Coordinate System** section of this guide.

Once you’ve entered the necessary information, click **“Create.”**  
The system will generate the project and automatically load it, placing you in the **Project Catalog** view where you can begin organizing folders and uploading spatial entities.

# Project Setup

<span class="rvts6">To modify Project settings, first go to the catalog and click on three-dot menu of your project and select Edit:</span>

[![image.png](https://help.mystart.com/uploads/images/gallery/2025-03/scaled-1680-/hIiimage.png)](https://help.mystart.com/uploads/images/gallery/2025-03/hIiimage.png)

<span class="rvts6">I</span>

[![image.png](https://help.mystart.com/uploads/images/gallery/2025-03/scaled-1680-/3y7image.png)](https://help.mystart.com/uploads/images/gallery/2025-03/3y7image.png)

# Project Coordinate System

Use the **“Coordinates”** section when creating or editing a project to define its units, reference systems, and spatial framework.

[![image.png](https://help.mystart.com/uploads/images/gallery/2025-03/scaled-1680-/3zXimage.png)](https://help.mystart.com/uploads/images/gallery/2025-03/3zXimage.png)

These settings are essential for aligning all spatial data correctly within your project and ensuring consistency across datasets.

<table border="1" cellpadding="0" class="MsoNormalTable" id="bkmrk-field-description-ti" style="border: 1pt solid rgb(255, 255, 255); width: 100%; height: 886.64px; border-collapse: collapse;"><thead><tr style="height: 19.7969px;"><td style="border: 1pt solid rgb(255, 255, 255); padding: 0.75pt; width: 13.4748%; height: 19.7969px;"><span style="color: rgb(0, 0, 0); background-color: rgb(255, 255, 255);">**Field**</span>

</td><td style="border: 1pt solid rgb(255, 255, 255); padding: 0.75pt; width: 86.4062%; height: 19.7969px;"><span style="color: rgb(0, 0, 0); background-color: rgb(255, 255, 255);">**Description**</span>

</td></tr></thead><tbody><tr style="height: 36.5938px;"><td style="border: 1pt solid rgb(255, 255, 255); padding: 0.75pt; width: 13.4748%; height: 36.5938px;">**Time Zone**

</td><td style="border: 1pt solid rgb(255, 255, 255); padding: 0.75pt; width: 86.4062%; height: 36.5938px;">Sets the local time zone for the project location. This helps timestamp data and coordinate updates across time-based processes.

</td></tr><tr style="height: 238.156px;"><td style="border: 1pt solid rgb(255, 255, 255); padding: 0.75pt; width: 13.4748%; height: 238.156px;">**Horizontal Datum**

</td><td style="border: 1pt solid rgb(255, 255, 255); padding: 0.75pt; width: 86.4062%; height: 238.156px;">A horizontal datum defines how latitude and longitude coordinates are calculated based on the shape of the Earth. VoxelSpace supports the following horizontal datums:   
  
• WGS 72  
• WGS 84  
• GRS 80  
• NAD27  
• NAD83  
• NAD83 (2011)  
• NAD83 HARN  
• NAD83 CSRS  
• GDA94  
• ETRS89  
• AGD66

</td></tr><tr style="height: 221.359px;"><td style="border: 1pt solid rgb(255, 255, 255); padding: 0.75pt; width: 13.4748%; height: 221.359px;">**Vertical Datum**

</td><td style="border: 1pt solid rgb(255, 255, 255); padding: 0.75pt; width: 86.4062%; height: 221.359px;">A vertical datum sets the reference surface used to measure elevation or depth. VoxelSpace supports the following vertical datums:   
  
• WGS 84  
• NGVD 29  
• NAVD 29  
• NAVD 88 (GEOID variants 96–12B)  
• CGVD 28  
• CGVD 2013  
• DVR 90  
• NN2000  
• NN54  
• DHHN92

</td></tr><tr style="height: 221.359px;"><td style="border: 1pt solid rgb(255, 255, 255); padding: 0.75pt; width: 13.4748%; height: 221.359px;">**Projection**

</td><td style="border: 1pt solid rgb(255, 255, 255); padding: 0.75pt; width: 86.4062%; height: 221.359px;">Defines the map projection used to represent the Earth’s curved surface in 2D/3D space. Supported projections include:   
  
• Latitude/Longitude  
• Longitude/Latitude  
• Earth-Centered Earth-Fixed (ECEF)  
• Mercator  
• Universal Transverse Mercator (UTM)  
• Transverse Mercator  
• Lambert Conformal Conic  
• AEAC  
• AMG  
• MGA

</td></tr><tr style="height: 19.7969px;"><td style="border: 1pt solid rgb(255, 255, 255); padding: 0.75pt; width: 13.4748%; height: 19.7969px;">**Units**

</td><td style="border: 1pt solid rgb(255, 255, 255); padding: 0.75pt; width: 86.4062%; height: 19.7969px;">Choose whether your project uses **meters** or **feet** for all distance measurements.

</td></tr><tr style="height: 19.7969px;"><td style="border: 1pt solid rgb(255, 255, 255); padding: 0.75pt; width: 13.4748%; height: 19.7969px;">**Voxel Size**

</td><td style="border: 1pt solid rgb(255, 255, 255); padding: 0.75pt; width: 86.4062%; height: 19.7969px;">Voxels are 3D cubes. This setting defines the edge length of each voxel (in project units).

</td></tr><tr style="height: 36.5938px;"><td style="border: 1pt solid rgb(255, 255, 255); padding: 0.75pt; width: 13.4748%; height: 36.5938px;">**Project Origin (X, Y, Z)**

</td><td style="border: 1pt solid rgb(255, 255, 255); padding: 0.75pt; width: 86.4062%; height: 36.5938px;">The origin point of the project’s coordinate space. All spatial data will be referenced relative to this point.

</td></tr><tr style="height: 36.5938px;"><td style="border: 1pt solid rgb(255, 255, 255); padding: 0.75pt; width: 13.4748%; height: 36.5938px;">**Min X, Y, Z (Read-only)**

</td><td style="border: 1pt solid rgb(255, 255, 255); padding: 0.75pt; width: 86.4062%; height: 36.5938px;">The minimum bounds of the coordinate system in each axis. Calculated automatically.

</td></tr><tr style="height: 36.5938px;"><td style="border: 1pt solid rgb(255, 255, 255); padding: 0.75pt; width: 13.4748%; height: 36.5938px;">**Max X, Y, Z (Read-only)**

</td><td style="border: 1pt solid rgb(255, 255, 255); padding: 0.75pt; width: 86.4062%; height: 36.5938px;">The maximum bounds of the coordinate system in each axis. Calculated automatically.

</td></tr></tbody></table>

<div class="rvps2" id="bkmrk-time-zone-the-time-z"></div>**Next Steps**

After setting the coordinate system, click **“Next”** to continue defining the dimensions and spatial extent of your project.

[![image.png](https://help.mystart.com/uploads/images/gallery/2025-03/scaled-1680-/p5Yimage.png)](https://help.mystart.com/uploads/images/gallery/2025-03/p5Yimage.png)

[![image.png](https://help.mystart.com/uploads/images/gallery/2025-03/scaled-1680-/Pi1image.png)](https://help.mystart.com/uploads/images/gallery/2025-03/Pi1image.png)

# Linking Users to Projects

VoxelSpace features a built-in security model that controls user access based on authentication and assigned permissions. Once a user is authenticated via the login provider, they can be linked to specific projects with appropriate access levels.

**Adding a User to a Project**

To assign a user to a project:

1\. **Go to your user profile** by clicking on your name or profile icon (My profile).

<span class="rvts6">[![Capture-new.PNG](https://help.mystart.com/uploads/images/gallery/2025-03/scaled-1680-/capture-new.PNG)](https://help.mystart.com/uploads/images/gallery/2025-03/capture-new.PNG)</span>

2\. Navigate to the **“My Team”** tab.

<span class="rvts6">[![Capture-new-2.PNG](https://help.mystart.com/uploads/images/gallery/2025-03/scaled-1680-/capture-new-2.PNG)](https://help.mystart.com/uploads/images/gallery/2025-03/capture-new-2.PNG)</span>

3\. Click **“Add New User”** to create a new user account.

4\. After the user is created, click the **Settings** icon next to their name.

5\. Select **“Add Project”** to assign a project to the user.

[![image.png](https://help.mystart.com/uploads/images/gallery/2025-03/scaled-1680-/7tOimage.png)](https://help.mystart.com/uploads/images/gallery/2025-03/7tOimage.png)

6\. In the dialog box, enter the following details:

- - - **User ID**: This is typically the user's email address, but it may vary depending on your authentication setup. If you're unsure, consult your system administrator.
        - **Access Level**: Choose between: 
            - **Read-Only**: The user can view project data but cannot modify or add content.
            - **Full Control**: The user can view, edit, add data, and manage user access for the project.

7\. Click **“Add User”** to send an invitation. The user will receive an email with instructions to join the platform and access the assigned project.

[![image.png](https://help.mystart.com/uploads/images/gallery/2025-03/scaled-1680-/40Wimage.png)](https://help.mystart.com/uploads/images/gallery/2025-03/40Wimage.png)

**Managing User Access**

- To **change a user’s access level**, click the **Settings** icon next to their name and select **“Access Level.”**

[![image.png](https://help.mystart.com/uploads/images/gallery/2025-03/scaled-1680-/UT2image.png)](https://help.mystart.com/uploads/images/gallery/2025-03/UT2image.png)

- To **remove a user from a project**, open the context menu beside their name and select **“Remove from Project.”**

# Creating a View

[Creating a View for your project. ](https://help.voxelspace.com/books/using-the-webui/page/creating-a-view)The WebUI provides two different ways to start the creation of a View...

More options for [View](https://help.voxelspace.com/books/using-the-webui/chapter/working-with-views)

# Adding Spatial Entities to a Project

You can use the VoxelSpace WebUI to add a wide range of **spatial entities** — including point clouds, block models, terrain, meshes, and more. These entities serve as the foundation for analysis, visualization, collaboration, and reporting within your project.

# Introduction

You can use the VoxelSpace WebUI to add a wide range of **spatial entities**—including point clouds, block models, terrain, meshes, and more. These entities serve as the foundation for analysis, visualization, collaboration, and reporting within your project.

 **Raw Data Samples**

 **[![download.png](https://help.voxelspace.com/uploads/images/gallery/2026-02/scaled-1680-/download.png)](https://help.voxelspace.com/uploads/images/gallery/2026-02/download.png)[Mesh](https://voxelspace.com/raw-data/sphere_01.obj)**

**[![download.png](https://help.voxelspace.com/uploads/images/gallery/2026-02/scaled-1680-/download.png)](https://help.voxelspace.com/uploads/images/gallery/2026-02/download.png)[Point Cloud](https://voxelspace.com/raw-data/points_25_8_5_lakes.xyz)**

**[![download.png](https://help.voxelspace.com/uploads/images/gallery/2026-02/scaled-1680-/download.png)](https://help.voxelspace.com/uploads/images/gallery/2026-02/download.png)[Ortho Imagery](https://voxelspace.com/raw-data/raster.zip)**

[![image.png](https://help.voxelspace.com/uploads/images/gallery/2025-08/scaled-1680-/vLSimage.png)](https://help.voxelspace.com/uploads/images/gallery/2025-08/vLSimage.png)

<div align="center" class="MsoNormal" id="bkmrk--2" style="text-align: center;">---

</div>1. **Add Spatial Entities**Inside your project, click **“Add Object”** to begin adding spatial entities. VoxelSpace supports a wide range of input formats:
    
    <div class="process-step-item"><div class="process-content"><div class="process-step-content">
    - **Point Clouds**
    - **Meshes (OBJ/FBX)**
    - **Block Models**
    - **Ortho-Imagery**
    
    </div></div></div>
2. **Process Your Raw Data**Once your raw data is in the system, VoxelSpace lets you convert it into optimized formats for analysis and visualization. These include:
    
    <div class="process-step-item"><div class="process-content"><div class="process-step-content">
    - **Indexed Mesh**
    - **Indexed Point Cloud**
    - **Voxel Terrain**
    - **Voxel Block Model**
    - **Voxelized Mesh**
    - **Ortho Voxel Terrain**
    
    </div></div></div>Choose the format that fits your use case—whether it's simulation, comparison, or rendering.
3. **Create a View**Views are where VoxelSpace truly shines. With a **View**, you can combine multiple datasets into a 3D scene, configure visual styles, explore cross-sections, and share insights with your team.
    
    Views are collaborative, reusable, and can be saved or shared across your organization.

<div class="process-step-item" id="bkmrk--3"><div class="process-content">  
</div></div><div class="process-step-item" id="bkmrk--4"><div class="process-content">  
</div></div>

# Point Cloud (Raw Data)

A **Point Cloud** entity stores raw spatial data collected from sources such as LiDAR or photogrammetry. Uploading point clouds into VoxelSpace is the first step toward visualizing and processing high-resolution terrain or structure data.

<span style="font-size: 11.0pt; line-height: 107%; font-family: 'Aptos',sans-serif; mso-ascii-theme-font: minor-latin; mso-fareast-font-family: Aptos; mso-fareast-theme-font: minor-latin; mso-hansi-theme-font: minor-latin; mso-bidi-font-family: 'Times New Roman'; mso-bidi-theme-font: minor-bidi; mso-ansi-language: EN-CA; mso-fareast-language: EN-US; mso-bidi-language: AR-SA;">Upload raw LiDAR or scanned data as a point cloud. The system accepts LAS, LAZ, ASCII, or ZIP formats.  
→ *Used for spatial analysis, terrain generation, and modeling.*</span>

<div align="center" class="MsoNormal" id="bkmrk-" style="text-align: center;">---

</div>**Uploading a Point Cloud**

1. Navigate to the **Catalog** section and select the project where you want to upload the point cloud.
2. Click the **“Add Object”** button.
3. From the dropdown menu, choose **“Point Cloud.”**

[![image.png](https://help.mystart.com/uploads/images/gallery/2025-03/scaled-1680-/NJBimage.png)](https://help.mystart.com/uploads/images/gallery/2025-03/NJBimage.png)

<span class="rvts6">  
</span>

4\. You’ll be prompted to enter the following details:

<table border="0" cellpadding="0" class="MsoNormalTable" id="bkmrk-field-description-%C2%A0-" style="width: 88.8095%;"><thead><tr style="mso-yfti-irow: 0; mso-yfti-firstrow: yes;"><td style="padding: 0.75pt; width: 23.5772%;">**Field**

</td><td style="padding: 0.75pt; width: 76.4228%;">**Description**

</td></tr></thead><tbody><tr style="mso-yfti-irow: 1;"><td style="padding: 0.75pt; width: 23.5772%;">**Item Name**

</td><td style="padding: 0.75pt; width: 76.4228%;">A descriptive, readable name for the new point cloud entity.

</td></tr><tr style="mso-yfti-irow: 2;"><td style="padding: 0.75pt; width: 23.5772%;">**Capture Date**

</td><td style="padding: 0.75pt; width: 76.4228%;">*(Optional)* The original date the point cloud data was collected.

</td></tr><tr style="mso-yfti-irow: 3;"><td style="padding: 0.75pt; width: 23.5772%;">**Horizontal Datum**

</td><td style="padding: 0.75pt; width: 76.4228%;">The horizontal reference system used (e.g., WGS 84, NAD83).

</td></tr><tr style="mso-yfti-irow: 4;"><td style="padding: 0.75pt; width: 23.5772%;">**Vertical Datum**

</td><td style="padding: 0.75pt; width: 76.4228%;">The vertical reference system used for elevation or depth.

</td></tr><tr style="mso-yfti-irow: 5;"><td style="padding: 0.75pt; width: 23.5772%;">**Projection**

</td><td style="padding: 0.75pt; width: 76.4228%;">The coordinate projection applied to the dataset.

</td></tr><tr style="mso-yfti-irow: 6;"><td style="padding: 0.75pt; width: 23.5772%;">**Horizontal Units**

</td><td style="padding: 0.75pt; width: 76.4228%;">Units used for horizontal measurements (e.g., meters or feet).

</td></tr><tr style="mso-yfti-irow: 7; mso-yfti-lastrow: yes;"><td style="padding: 0.75pt; width: 23.5772%;">**Vertical Units**

</td><td style="padding: 0.75pt; width: 76.4228%;">Units used for vertical measurements (e.g., meters or feet).

</td></tr></tbody></table>

<span style="font-size: 12.0pt; line-height: 107%; mso-fareast-font-family: 'Times New Roman'; mso-bidi-font-family: 'Times New Roman'; mso-font-kerning: 0pt; mso-ligatures: none; mso-fareast-language: EN-CA;">5. After entering the required metadata, click **“Choose Files”** to upload your data.</span>

<span style="font-size: 12.0pt; line-height: 107%; mso-fareast-font-family: 'Times New Roman'; mso-bidi-font-family: 'Times New Roman'; mso-font-kerning: 0pt; mso-ligatures: none; mso-fareast-language: EN-CA;">You can select multiple files during upload. The platform currently supports the following formats:</span>

- **<span style="font-size: 12.0pt; line-height: 107%; mso-fareast-font-family: 'Times New Roman'; mso-bidi-font-family: 'Times New Roman'; mso-font-kerning: 0pt; mso-ligatures: none; mso-fareast-language: EN-CA;">Text files (ASCII)</span>**<span style="font-size: 12.0pt; line-height: 107%; mso-fareast-font-family: 'Times New Roman'; mso-bidi-font-family: 'Times New Roman'; mso-font-kerning: 0pt; mso-ligatures: none; mso-fareast-language: EN-CA;"> with comma- or space-separated values</span>
- **<span style="font-size: 12.0pt; line-height: 107%; mso-fareast-font-family: 'Times New Roman'; mso-bidi-font-family: 'Times New Roman'; mso-font-kerning: 0pt; mso-ligatures: none; mso-fareast-language: EN-CA;">LAS files</span>**
- **<span style="font-size: 12.0pt; line-height: 107%; mso-fareast-font-family: 'Times New Roman'; mso-bidi-font-family: 'Times New Roman'; mso-font-kerning: 0pt; mso-ligatures: none; mso-fareast-language: EN-CA;">LAZ files</span>**
- **<span style="font-size: 12.0pt; line-height: 107%; mso-fareast-font-family: 'Times New Roman'; mso-bidi-font-family: 'Times New Roman'; mso-font-kerning: 0pt; mso-ligatures: none; mso-fareast-language: EN-CA;">ZIP archives</span>**<span style="font-size: 12.0pt; line-height: 107%; mso-fareast-font-family: 'Times New Roman'; mso-bidi-font-family: 'Times New Roman'; mso-font-kerning: 0pt; mso-ligatures: none; mso-fareast-language: EN-CA;"> containing any of the above formats</span>

<span style="font-size: 12.0pt; line-height: 107%; mso-fareast-font-family: 'Times New Roman'; mso-bidi-font-family: 'Times New Roman'; mso-font-kerning: 0pt; mso-ligatures: none; mso-fareast-language: EN-CA;"> </span>

<span style="font-size: 12.0pt; line-height: 107%; mso-fareast-font-family: 'Times New Roman'; mso-bidi-font-family: 'Times New Roman'; mso-font-kerning: 0pt; mso-ligatures: none; mso-fareast-language: EN-CA;">6. Once files are selected, click **“Create”** to begin the upload process.</span>

<span style="font-size: 12.0pt; line-height: 107%; mso-fareast-font-family: 'Times New Roman'; mso-bidi-font-family: 'Times New Roman'; mso-font-kerning: 0pt; mso-ligatures: none; mso-fareast-language: EN-CA;">You can monitor the upload progress from the **“Pending”** section within the selected project.</span>

# Ortho-Imagery (Raw Data)

The **Ortho-Imagery** entity stores a set of georeferenced images—typically aerial or satellite imagery—used for detailed mapping, visualization, or terrain analysis.

<span style="font-size: 11.0pt; line-height: 107%; font-family: 'Aptos',sans-serif; mso-ascii-theme-font: minor-latin; mso-fareast-font-family: Aptos; mso-fareast-theme-font: minor-latin; mso-hansi-theme-font: minor-latin; mso-bidi-font-family: 'Times New Roman'; mso-bidi-theme-font: minor-bidi; mso-ansi-language: EN-CA; mso-fareast-language: EN-US; mso-bidi-language: AR-SA;">Add georeferenced aerial imagery with associated world files (e.g., JPG + JGW). Supports bulk uploads via ZIP.  
→ *Ideal for surface visualization and texture mapping.*</span>

<div align="center" class="MsoNormal" id="bkmrk-" style="text-align: center;">---

</div>**Uploading Ortho-Imagery**

1. Navigate to your project’s **Catalog** section and click **“Add Object.”**
2. From the list, select **“Ortho-Imagery.”**

[![image.png](https://help.mystart.com/uploads/images/gallery/2025-03/scaled-1680-/BCUimage.png)](https://help.mystart.com/uploads/images/gallery/2025-03/BCUimage.png)

 3. You’ll be prompted to provide the following metadata:

<table border="0" cellpadding="0" class="MsoNormalTable" id="bkmrk-field-description-%C2%A0-" style="width: 866px; margin-left: 33.75pt; height: 158px;" width="0"><thead><tr style="mso-yfti-irow: 0; mso-yfti-firstrow: yes;"><td style="padding: 0.75pt; width: 225.812px;">**Field**

</td><td style="padding: 0.75pt; width: 517.844px;">**Description**

</td></tr></thead><tbody><tr style="mso-yfti-irow: 1;"><td style="padding: 0.75pt; width: 225.812px;">**Item Name**

</td><td style="padding: 0.75pt; width: 517.844px;">A readable, descriptive name for the new imagery set.

</td></tr><tr style="mso-yfti-irow: 2;"><td style="padding: 0.75pt; width: 225.812px;">**Capture Date**

</td><td style="padding: 0.75pt; width: 517.844px;">*(Optional)* The original date when the imagery was captured.

</td></tr><tr style="mso-yfti-irow: 3;"><td style="padding: 0.75pt; width: 225.812px;">**Horizontal Datum**

</td><td style="padding: 0.75pt; width: 517.844px;">The horizontal datum used in the world registration files (e.g., WGS 84, NAD83).

</td></tr><tr style="mso-yfti-irow: 4;"><td style="padding: 0.75pt; width: 225.812px;">**Projection**

</td><td style="padding: 0.75pt; width: 517.844px;">The projection used by the world registration files.

</td></tr><tr style="mso-yfti-irow: 5; mso-yfti-lastrow: yes;"><td style="padding: 0.75pt; width: 225.812px;">**Horizontal Units**

</td><td style="padding: 0.75pt; width: 517.844px;">Units used in the registration files (typically meters or feet).

</td></tr></tbody></table>

**Uploading Files**

<span style="font-size: 10.0pt; mso-bidi-font-size: 11.0pt; line-height: 107%; font-family: Symbol; mso-fareast-font-family: Symbol; mso-bidi-font-family: Symbol;"><span style="mso-list: Ignore;">·<span style="font: 7.0pt 'Times New Roman';"> </span></span></span>Click **“Choose Files”** to select the image files you wish to upload.

<span style="font-size: 10.0pt; mso-bidi-font-size: 11.0pt; line-height: 107%; font-family: Symbol; mso-fareast-font-family: Symbol; mso-bidi-font-family: Symbol;"><span style="mso-list: Ignore;">·<span style="font: 7.0pt 'Times New Roman';"> </span></span></span>Each image **must have a corresponding world file** for proper georeferencing.

<span style="font-size: 10.0pt; mso-bidi-font-size: 11.0pt; line-height: 107%; font-family: Symbol; mso-fareast-font-family: Symbol; mso-bidi-font-family: Symbol;"><span style="mso-list: Ignore;">·<span style="font: 7.0pt 'Times New Roman';"> </span></span></span>You can also upload **ZIP archives** that contain both images and their associated world registration files.

<table border="0" cellpadding="0" class="MsoNormalTable" id="bkmrk-image-format-expecte" style="mso-cellspacing: 1.5pt; margin-left: 69.75pt; mso-yfti-tbllook: 1184;"><thead><tr style="mso-yfti-irow: 0; mso-yfti-firstrow: yes;"><td style="width: 97.0pt; padding: .75pt .75pt .75pt .75pt;" width="132">**Image Format**

</td><td style="width: 125.95pt; padding: .75pt .75pt .75pt .75pt;" width="171">**Expected World File Extension**

</td></tr></thead><tbody><tr style="mso-yfti-irow: 1;"><td style="width: 97.0pt; padding: .75pt .75pt .75pt .75pt;" width="132">.JPG

</td><td style="width: 125.95pt; padding: .75pt .75pt .75pt .75pt;" width="171">.JGW

</td></tr><tr style="mso-yfti-irow: 2;"><td style="width: 97.0pt; padding: .75pt .75pt .75pt .75pt;" width="132">.PNG

</td><td style="width: 125.95pt; padding: .75pt .75pt .75pt .75pt;" width="171">.PGW

</td></tr><tr style="mso-yfti-irow: 3;"><td style="width: 97.0pt; padding: .75pt .75pt .75pt .75pt;" width="132">.BMP

</td><td style="width: 125.95pt; padding: .75pt .75pt .75pt .75pt;" width="171">.BPW

</td></tr><tr style="mso-yfti-irow: 4;"><td style="width: 97.0pt; padding: .75pt .75pt .75pt .75pt;" width="132">.TGA

</td><td style="width: 125.95pt; padding: .75pt .75pt .75pt .75pt;" width="171">.TAW

</td></tr><tr style="mso-yfti-irow: 5; mso-yfti-lastrow: yes;"><td style="width: 97.0pt; padding: .75pt .75pt .75pt .75pt;" width="132">.TIF

</td><td style="width: 125.95pt; padding: .75pt .75pt .75pt .75pt;" width="171">.TFW

</td></tr></tbody></table>

4\. Once your files are selected, click **“Create”** to begin the upload process.

5\. You can track the progress of your upload in the **“Pending”** section of the project’s page.

# Heightmap (DEM)

<span class="rvts6">A heightmap entity is a special type of Ortho-Imagery set where images describe altitude instead of color. The images for these sets must be in 16bit grayscale PNG format.</span>

<span class="rvts6">Once you select “Heightmap” from the “Add” menu, you will see the following options:</span>

[![image.png](https://help.voxelspace.com/uploads/images/gallery/2025-08/scaled-1680-/7fvimage.png)](https://help.voxelspace.com/uploads/images/gallery/2025-08/7fvimage.png)

<span class="rvts6">  
</span>

<div class="rvps2" id="bkmrk-item-name-a-readable"><table border="1" cellpadding="7" cellspacing="-1"><tbody><tr valign="top"><td valign="top" width="132"><span class="rvts6">Item Name</span>

</td><td valign="top" width="491"><span class="rvts6">A readable name for the new entity</span>

</td></tr><tr valign="top"><td valign="top" width="132"><span class="rvts6">Minimum Height</span>

</td><td valign="top" width="491"><span class="rvts6">Elevation value for black pixels in the heightmap</span>

</td></tr><tr valign="top"><td valign="top" width="132"><span class="rvts6">Maximum Height</span>

</td><td valign="top" width="491"><span class="rvts6">Elevation value for white pixels in the heightmap</span>

</td></tr><tr valign="top"><td valign="top" width="132"><span class="rvts6">Capture Device</span>

</td><td valign="top" width="491"><span class="rvts6">An optional string to identify capture device</span>

</td></tr><tr valign="top"><td valign="top" width="132"><span class="rvts6">Capture Date</span>

</td><td valign="top" width="491"><span class="rvts6">An optional field containing the original capture date</span>

</td></tr><tr valign="top"><td valign="top" width="132"><span class="rvts6">Horizontal Datum</span>

</td><td valign="top" width="491"><span class="rvts6">The horizontal datum used in the heightmap</span>

</td></tr><tr valign="top"><td valign="top" width="132"><span class="rvts6">Vertical Datum</span>

</td><td valign="top" width="491"><span class="rvts6">The vertical datum used in the heightmap</span>

</td></tr><tr valign="top"><td valign="top" width="132"><span class="rvts6">Projection</span>

</td><td valign="top" width="491"><span class="rvts6">The projection used by the heightmap</span>

</td></tr><tr valign="top"><td valign="top" width="132"><span class="rvts6">Horizontal Units</span>

</td><td valign="top" width="491"><span class="rvts6">The horizontal unit type used in the heightmap</span>

</td></tr><tr valign="top"><td valign="top" width="132"><span class="rvts6">Vertical Units</span>

</td><td valign="top" width="491"><span class="rvts6">The vertical unit type used in the heightmap</span>

</td></tr></tbody></table>

</div><span class="rvts6"> </span><span class="rvts6">Click “Choose Files” to select which files to upload as the Ortho-Imagery set. Each image in the set is expected to have a matching world registration file. The following table lists the supported image formats and the expected world file extension for the format:</span>

<span class="rvts6">  
</span>

<div class="rvps2" id="bkmrk-image-format-extensi"><table border="1" cellpadding="7" cellspacing="-1" width="359"><tbody><tr valign="top"><td valign="top" width="170"><span class="rvts6">Image Format Extension</span>

</td><td valign="top" width="189"><span class="rvts6">Expected World File Extension</span>

</td></tr><tr valign="top"><td valign="top" width="170"><span class="rvts6">.PNG (16bit grayscale)</span>

</td><td valign="top" width="189"><span class="rvts6">.PGW</span>

</td></tr></tbody></table>

</div><span class="rvts6"> </span><span class="rvts6">You can also select multiple archive ZIP files, which should contain the image and matching world registration files.</span>

<span class="rvts6">Click on “Create” to begin the upload process. You can track the upload operation from the “Pending” section in the project’s page.</span>

# Block Model (Raw Data)

A **Block Model** entity stores structured 3D block data—typically used in resource estimation, geological modeling, and spatial analysis. The model is uploaded as a **comma-separated ASCII text file**, where each row represents an individual block.

Import structured block models in CSV format. Each row represents a volumetric block with positional and attribute data.  
→ *Commonly used in mining and geological modeling.*

<div align="center" class="MsoNormal" id="bkmrk-" style="text-align: center;">---

</div>**Uploading a Block Model**

1. Navigate to your project’s **Catalog** section and click **“Add Object.”**
2. From the dropdown, select **“Block Model.”**

[![image.png](https://help.mystart.com/uploads/images/gallery/2025-03/scaled-1680-/MFGimage.png)](https://help.mystart.com/uploads/images/gallery/2025-03/MFGimage.png)

3\. Fill out the following fields:

<table border="0" cellpadding="0" class="MsoNormalTable" id="bkmrk-field-description-%C2%A0-" style="mso-cellspacing: 1.5pt; mso-yfti-tbllook: 1184;"><thead><tr style="mso-yfti-irow: 0; mso-yfti-firstrow: yes;"><td style="padding: .75pt .75pt .75pt .75pt;">**Field**

</td><td style="padding: .75pt .75pt .75pt .75pt;">**Description**

</td></tr></thead><tbody><tr style="mso-yfti-irow: 1;"><td style="padding: .75pt .75pt .75pt .75pt;">**Item Name**

</td><td style="padding: .75pt .75pt .75pt .75pt;">A descriptive name for the new block model entity.

</td></tr><tr style="mso-yfti-irow: 2;"><td style="padding: .75pt .75pt .75pt .75pt;">**Capture Date**

</td><td style="padding: .75pt .75pt .75pt .75pt;">*(Optional)* The original date the model data was captured.

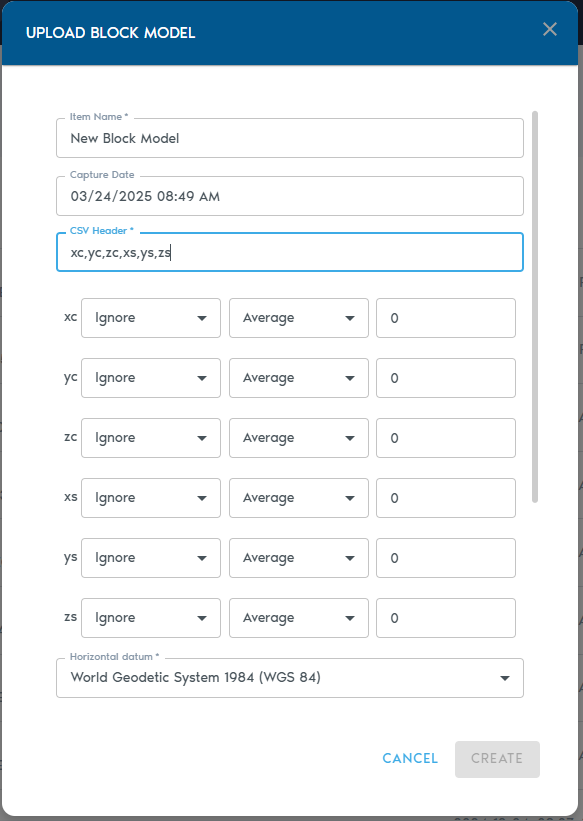
</td></tr><tr style="mso-yfti-irow: 3;"><td style="padding: .75pt .75pt .75pt .75pt;">**CSV Header**

</td><td style="padding: .75pt .75pt .75pt .75pt;">A comma-separated line of headers that define how each column in the block model should be interpreted. (Details below.)

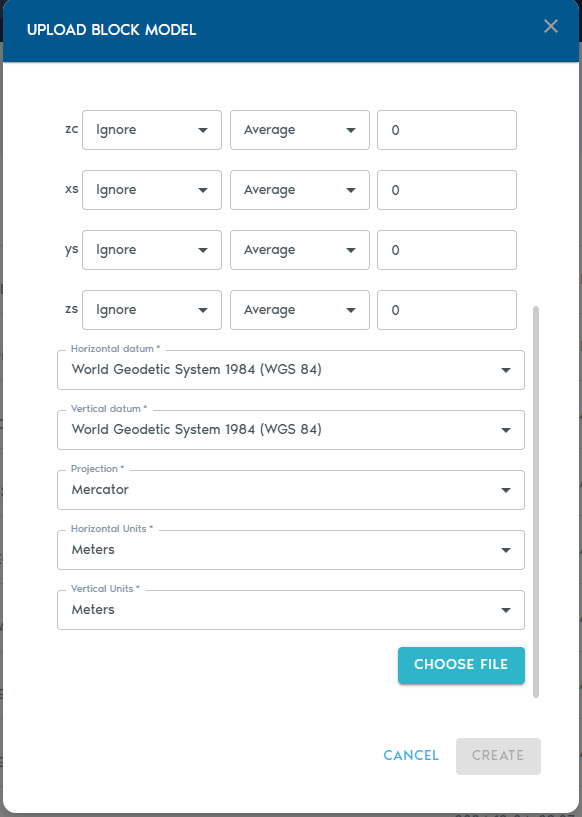
</td></tr><tr style="mso-yfti-irow: 4;"><td style="padding: .75pt .75pt .75pt .75pt;">**Horizontal Datum**

</td><td style="padding: .75pt .75pt .75pt .75pt;">The horizontal reference system used in the model.

</td></tr><tr style="mso-yfti-irow: 5;"><td style="padding: .75pt .75pt .75pt .75pt;">**Vertical Datum**

</td><td style="padding: .75pt .75pt .75pt .75pt;">The vertical reference system used for elevation values.

</td></tr><tr style="mso-yfti-irow: 6;"><td style="padding: .75pt .75pt .75pt .75pt;">**Projection**

</td><td style="padding: .75pt .75pt .75pt .75pt;">The map projection used in the dataset.

</td></tr><tr style="mso-yfti-irow: 7;"><td style="padding: .75pt .75pt .75pt .75pt;">**Horizontal Units**

</td><td style="padding: .75pt .75pt .75pt .75pt;">Units for X and Y coordinates (e.g., meters, feet).

</td></tr><tr style="mso-yfti-irow: 8; mso-yfti-lastrow: yes;"><td style="padding: .75pt .75pt .75pt .75pt;">**Vertical Units**

</td><td style="padding: .75pt .75pt .75pt .75pt;">Units for Z coordinates (e.g., meters, feet).

</td></tr></tbody></table>

**CSV Header**

The **CSV Header** field defines how each column in your file should be interpreted. For example, a header line like:  
XC,YC,ZC,XL,YL,ZL,AU,CU  
…will produce a list of **Column Definitions** for each value, allowing you to specify their role in the model.

<table border="1" id="bkmrk--2" style="border-collapse: collapse; width: 100%;"><colgroup><col style="width: 50%;"></col><col style="width: 50%;"></col></colgroup><tbody><tr><td>[![image.png](https://help.mystart.com/uploads/images/gallery/2025-03/scaled-1680-/WvSimage.png)](https://help.mystart.com/uploads/images/gallery/2025-03/WvSimage.png)

</td><td>[![image.png](https://help.mystart.com/uploads/images/gallery/2025-03/scaled-1680-/fkFimage.png)](https://help.mystart.com/uploads/images/gallery/2025-03/fkFimage.png)

</td></tr></tbody></table>

**Column Types**

Each column must be assigned a **Type**, which tells the system how to process it:

<table border="0" cellpadding="0" class="MsoNormalTable" id="bkmrk-type-purpose-%C2%A0-ignor" style="width: 68.6905%; height: 252px;"><thead><tr style="height: 36.5938px;"><td style="padding: 0.75pt; width: 28.3122%; height: 36.5938px;">**Type**

</td><td style="padding: 0.75pt; width: 71.6878%; height: 36.5938px;">**Purpose**

</td></tr></thead><tbody><tr style="height: 36.5938px;"><td style="padding: 0.75pt; width: 28.3122%; height: 36.5938px;">**Ignore**

</td><td style="padding: 0.75pt; width: 71.6878%; height: 36.5938px;">Exclude this column from processing.

</td></tr><tr style="height: 36.5938px;"><td style="padding: 0.75pt; width: 28.3122%; height: 36.5938px;">**Set**

</td><td style="padding: 0.75pt; width: 71.6878%; height: 36.5938px;">The column contains a small set of repeating categorical values.

</td></tr><tr style="height: 19.7969px;"><td style="padding: 0.75pt; width: 28.3122%; height: 19.7969px;">**Value**

</td><td style="padding: 0.75pt; width: 71.6878%; height: 19.7969px;">Numeric values (e.g., grades, densities).

</td></tr><tr style="height: 19.7969px;"><td style="padding: 0.75pt; width: 28.3122%; height: 19.7969px;">**<span lang="FR-CA" style="mso-ansi-language: FR-CA;">Block Centroid X/Y/Z</span>**

</td><td style="padding: 0.75pt; width: 71.6878%; height: 19.7969px;">Coordinates for the block’s center point.

</td></tr><tr style="height: 19.7969px;"><td style="padding: 0.75pt; width: 28.3122%; height: 19.7969px;">**Block Origin X/Y/Z**

</td><td style="padding: 0.75pt; width: 71.6878%; height: 19.7969px;">Coordinates for the block’s origin corner.

</td></tr><tr style="height: 19.7969px;"><td style="padding: 0.75pt; width: 28.3122%; height: 19.7969px;">**<span lang="FR-CA" style="mso-ansi-language: FR-CA;">Block Dimension X/Y/Z</span>**

</td><td style="padding: 0.75pt; width: 71.6878%; height: 19.7969px;">Size of the block along each axis.

</td></tr></tbody></table>

**Note:** You must choose **either** block centroids **or** block origins for positioning—not both. Using both will result in an input error.

**Level of Detail (LOD) Aggregation**

Each numeric column (e.g., grades or quantities) can also be configured with a **Level of Detail (LOD) operation**, which determines how values are aggregated in lower-resolution views:

<table border="0" cellpadding="0" class="MsoNormalTable" id="bkmrk-lod-option-descripti" style="width: 49.4048%; height: 118.781px;"><thead><tr style="height: 19.7969px;"><td style="padding: 0.75pt; width: 24.6914%; height: 19.7969px;">**LOD Option**

</td><td style="padding: 0.75pt; width: 75.3086%; height: 19.7969px;">**Description**

</td></tr></thead><tbody><tr style="height: 19.7969px;"><td style="padding: 0.75pt; width: 24.6914%; height: 19.7969px;">**Average**

</td><td style="padding: 0.75pt; width: 75.3086%; height: 19.7969px;">Average of all higher-resolution values.

</td></tr><tr style="height: 19.7969px;"><td style="padding: 0.75pt; width: 24.6914%; height: 19.7969px;">**Min**

</td><td style="padding: 0.75pt; width: 75.3086%; height: 19.7969px;">Minimum value from the finer data.

</td></tr><tr style="height: 19.7969px;"><td style="padding: 0.75pt; width: 24.6914%; height: 19.7969px;">**Max**

</td><td style="padding: 0.75pt; width: 75.3086%; height: 19.7969px;">Maximum value from the finer data.

</td></tr><tr style="height: 19.7969px;"><td style="padding: 0.75pt; width: 24.6914%; height: 19.7969px;">**Add**

</td><td style="padding: 0.75pt; width: 75.3086%; height: 19.7969px;">Sum of all values (ideal for counters).

</td></tr><tr style="height: 19.7969px;"><td style="padding: 0.75pt; width: 24.6914%; height: 19.7969px;">**Multiply**

</td><td style="padding: 0.75pt; width: 75.3086%; height: 19.7969px;">Product of all values.

</td></tr></tbody></table>

**Uploading the File**

- Click **“Choose File”** to upload your block model file (CSV or TXT format).
- You may also upload a **ZIP archive** that contains your ASCII file.

<div align="center" class="MsoNormal" id="bkmrk--3" style="text-align: center;">---

</div>Click **“Create”** to start the upload process. You can monitor the progress in the project’s **“Pending”** section.

# Mesh (Raw Data)

<span style="font-size: 11.0pt; line-height: 107%; font-family: 'Aptos',sans-serif; mso-ascii-theme-font: minor-latin; mso-fareast-font-family: Aptos; mso-fareast-theme-font: minor-latin; mso-hansi-theme-font: minor-latin; mso-bidi-font-family: 'Times New Roman'; mso-bidi-theme-font: minor-bidi; mso-ansi-language: EN-CA; mso-fareast-language: EN-US; mso-bidi-language: AR-SA;">A **Mesh** entity stores raw 3D surface geometry, such as terrain models, structural designs, or scanned objects. VoxelSpace currently supports mesh uploads in the **FBX** and **OBJ** formats.</span>

<span style="font-size: 11.0pt; line-height: 107%; font-family: 'Aptos',sans-serif; mso-ascii-theme-font: minor-latin; mso-fareast-font-family: Aptos; mso-fareast-theme-font: minor-latin; mso-hansi-theme-font: minor-latin; mso-bidi-font-family: 'Times New Roman'; mso-bidi-theme-font: minor-bidi; mso-ansi-language: EN-CA; mso-fareast-language: EN-US; mso-bidi-language: AR-SA;">→ *Useful for infrastructure, CAD designs, and high-detail scanned models.*</span>

<div align="center" class="MsoNormal" id="bkmrk-" style="text-align: center;">---

</div>**Uploading a Mesh**

1. In your project’s **Catalog**, click **“Add Object.”**
2. Select **“Mesh”** from the dropdown menu.

[![image.png](https://help.mystart.com/uploads/images/gallery/2025-03/scaled-1680-/Wzvimage.png)](https://help.mystart.com/uploads/images/gallery/2025-03/Wzvimage.png)

3\. Fill in the required metadata fields:

<table border="0" cellpadding="0" class="MsoNormalTable" id="bkmrk-field-description-%C2%A0-" style="width: 88.8095%; height: 208.766px;"><thead><tr style="height: 36.5938px;"><td style="padding: 0.75pt; width: 26.3743%; height: 36.5938px;">**Field**

</td><td style="padding: 0.75pt; width: 73.6282%; height: 36.5938px;">**Description**

</td></tr></thead><tbody><tr style="height: 36.5938px;"><td style="padding: 0.75pt; width: 26.3743%; height: 36.5938px;">**Item Name**

</td><td style="padding: 0.75pt; width: 73.6282%; height: 36.5938px;">A clear, descriptive name for the mesh entity.

</td></tr><tr style="height: 36.5938px;"><td style="padding: 0.75pt; width: 26.3743%; height: 36.5938px;">**Capture Date**

</td><td style="padding: 0.75pt; width: 73.6282%; height: 36.5938px;">*(Optional)* The date the mesh was captured or created.

</td></tr><tr style="height: 19.7969px;"><td style="padding: 0.75pt; width: 26.3743%; height: 19.7969px;">**Horizontal Datum**

</td><td style="padding: 0.75pt; width: 73.6282%; height: 19.7969px;">The horizontal reference system used in the mesh.

</td></tr><tr style="height: 19.7969px;"><td style="padding: 0.75pt; width: 26.3743%; height: 19.7969px;">**Vertical Datum**

</td><td style="padding: 0.75pt; width: 73.6282%; height: 19.7969px;">The vertical reference system used for elevation.

</td></tr><tr style="height: 19.7969px;"><td style="padding: 0.75pt; width: 26.3743%; height: 19.7969px;">**Projection**

</td><td style="padding: 0.75pt; width: 73.6282%; height: 19.7969px;">The coordinate projection applied to the dataset.

</td></tr><tr style="height: 19.7969px;"><td style="padding: 0.75pt; width: 26.3743%; height: 19.7969px;">**Horizontal Units**

</td><td style="padding: 0.75pt; width: 73.6282%; height: 19.7969px;">Units for X and Y coordinates (e.g., meters or feet).

</td></tr><tr style="height: 19.7969px;"><td style="padding: 0.75pt; width: 26.3743%; height: 19.7969px;">**Vertical Units**

</td><td style="padding: 0.75pt; width: 73.6282%; height: 19.7969px;">Units for Z coordinates (e.g., meters or feet).

</td></tr></tbody></table>

**Note:** The system assumes that all vertex coordinates in the mesh are already aligned with the project’s coordinate space. For this reason, it does not require separate transformation or alignment settings during upload.

**Uploading Files**

- Click **“Choose File”** to select your **.FBX** or **.OBJ** mesh file.
- You may also upload a **ZIP archive** containing the mesh and any associated assets (e.g., textures).

# Indexed Mesh (Processed)

An **Indexed Mesh** is a processed version of a raw Mesh entity that has been spatially indexed according to the project’s coordinate system. This allows the mesh to be efficiently visualized and combined with other spatial datasets within VoxelSpace.

<div align="center" class="MsoNormal" id="bkmrk-" style="text-align: center;">---

</div>**Creating an Indexed Mesh**

1. In your project’s **Catalog**, click **“Add Object.”**
2. Select **“Indexed Mesh”** from the dropdown menu.

[![image.png](https://help.mystart.com/uploads/images/gallery/2025-03/scaled-1680-/glCimage.png)](https://help.mystart.com/uploads/images/gallery/2025-03/glCimage.png)

 3. Complete the following fields:

<table border="0" cellpadding="0" class="MsoNormalTable" id="bkmrk-field-description-%C2%A0-" style="width: 94.4048%; height: 222.563px;"><thead><tr style="height: 36.5938px;"><td style="padding: 0.75pt; width: 17.1315%; height: 36.5938px;">**Field**

</td><td style="padding: 0.75pt; width: 82.8685%; height: 36.5938px;">**Description**

</td></tr></thead><tbody><tr style="height: 36.5938px;"><td style="padding: 0.75pt; width: 17.1315%; height: 36.5938px;">**Item Name**

</td><td style="padding: 0.75pt; width: 82.8685%; height: 36.5938px;">A readable name for the new Indexed Mesh entity.

</td></tr><tr style="height: 36.5938px;"><td style="padding: 0.75pt; width: 17.1315%; height: 36.5938px;">**Source Mesh**

</td><td style="padding: 0.75pt; width: 82.8685%; height: 36.5938px;">Choose a raw Mesh entity from the list. This is the base mesh that will be indexed.

</td></tr><tr style="height: 36.5938px;"><td style="padding: 0.75pt; width: 17.1315%; height: 36.5938px;">**Translate X/Y/Z**

</td><td style="padding: 0.75pt; width: 82.8685%; height: 36.5938px;">Enter values to move (translate) the mesh along the X, Y, or Z axis.

</td></tr><tr style="height: 36.5938px;"><td style="padding: 0.75pt; width: 17.1315%; height: 36.5938px;">**Scale X/Y/Z**

</td><td style="padding: 0.75pt; width: 82.8685%; height: 36.5938px;">Apply scaling factors to each axis. A value of **1.0** maintains the original scale.

</td></tr><tr style="height: 19.7969px;"><td style="padding: 0.75pt; width: 17.1315%; height: 19.7969px;">**Rotate X/Y/Z**

</td><td style="padding: 0.75pt; width: 82.8685%; height: 19.7969px;">Specify Euler rotation angles (in degrees) around each axis.

</td></tr><tr style="height: 19.7969px;"><td style="padding: 0.75pt; width: 17.1315%; height: 19.7969px;">**Rotation Order**

</td><td style="padding: 0.75pt; width: 82.8685%; height: 19.7969px;">Define the sequence in which the Euler rotations are applied (e.g., XYZ, ZYX).

</td></tr></tbody></table>

**Finalizing the Process**

Once all parameters are set:

- Click **“Create”** to start the indexing operation.
- The system will process the mesh and generate a spatially indexed version. You can monitor the status in the project’s **“Pending”** section.

<div align="center" class="MsoNormal" id="bkmrk--2" style="text-align: center;">---

</div>**Viewing the Indexed Mesh**

After processing is complete:

- Click the **“View”** button next to the Indexed Mesh entry in your project’s catalog to open it.
- Alternatively, create a **View entity** and assign the Indexed Mesh as its source dataset to incorporate it into a broader visualization.

# Indexed Point Cloud (Processed)

An **Indexed Point Cloud** is a spatially-processed version of a raw Point Cloud entity. By applying the project’s spatial index, this format enables fast visualization, filtering, and integration with other spatial datasets in VoxelSpace.

<div align="center" class="MsoNormal" id="bkmrk-" style="text-align: center;">---

</div>**Creating an Indexed Point Cloud**

1. Navigate to the **Catalog** section of your project.
2. Click the **“Add Object”** button and select **“Indexed Points”** from the dropdown menu.

[![image.png](https://help.mystart.com/uploads/images/gallery/2025-03/scaled-1680-/w0kimage.png)](https://help.mystart.com/uploads/images/gallery/2025-03/w0kimage.png)

 3. Complete the required fields:

<table border="0" cellpadding="0" class="MsoNormalTable" id="bkmrk-field-description-it" style="mso-cellspacing: 1.5pt; mso-yfti-tbllook: 1184;"><thead><tr style="mso-yfti-irow: 0; mso-yfti-firstrow: yes;"><td style="padding: .75pt .75pt .75pt .75pt;">**Field**

</td><td style="padding: .75pt .75pt .75pt .75pt;">**Description**

</td></tr></thead><tbody><tr style="mso-yfti-irow: 1;"><td style="padding: .75pt .75pt .75pt .75pt;">**Item Name**

</td><td style="padding: .75pt .75pt .75pt .75pt;">A clear, descriptive name for the new Indexed Point Cloud entity.

</td></tr><tr style="mso-yfti-irow: 2; mso-yfti-lastrow: yes;"><td style="padding: .75pt .75pt .75pt .75pt;">**Source Mesh**

</td><td style="padding: .75pt .75pt .75pt .75pt;">Select a raw **Point Cloud** from the list. This will serve as the input for the indexing process.

</td></tr></tbody></table>

**Indexing the Point Cloud**

- After selecting your source and providing a name, click **“Create”** to initiate the indexing process.
- You can monitor the progress in the project’s **“Pending”** section.

<div align="center" class="MsoNormal" id="bkmrk--2" style="text-align: center;">---

</div>**Viewing the Indexed Point Cloud**

Once processing is complete:

- Use the **“View”** button next to the Indexed Point Cloud in the Catalog to open and explore it.
- Alternatively, you can create a **View entity** and designate the Indexed Point Cloud as its data source for broader analysis and visualization.

# Voxel Point Cloud (Processed)

A **Voxel Point Cloud** entity transforms a collection of spherical point cloud captures—often from mobile or static LiDAR devices—into a unified, volumetric voxel model. This format is ideal for analyzing spatial density and structure within 3D environments.

Transform spherical point cloud captures into a single volumetric voxel model, useful for dense interior or tunnel scans.  
→ *Enables volume-based analysis and structure identification.*

<div align="center" class="MsoNormal" id="bkmrk-" style="text-align: center;">---

</div>**Creating a Voxel Point Cloud**

1. In your project’s **Catalog**, click the **“Add Object”** button and select **“Voxelized Points”** from the dropdown menu.

<table border="1" id="bkmrk--1" style="border-collapse: collapse; width: 100%;"><colgroup><col style="width: 50%;"></col><col style="width: 50%;"></col></colgroup><tbody><tr><td>[![image.png](https://help.mystart.com/uploads/images/gallery/2025-03/scaled-1680-/hBgimage.png)](https://help.mystart.com/uploads/images/gallery/2025-03/hBgimage.png)

</td><td>[![image.png](https://help.mystart.com/uploads/images/gallery/2025-03/scaled-1680-/VB3image.png)](https://help.mystart.com/uploads/images/gallery/2025-03/VB3image.png)

</td></tr></tbody></table>

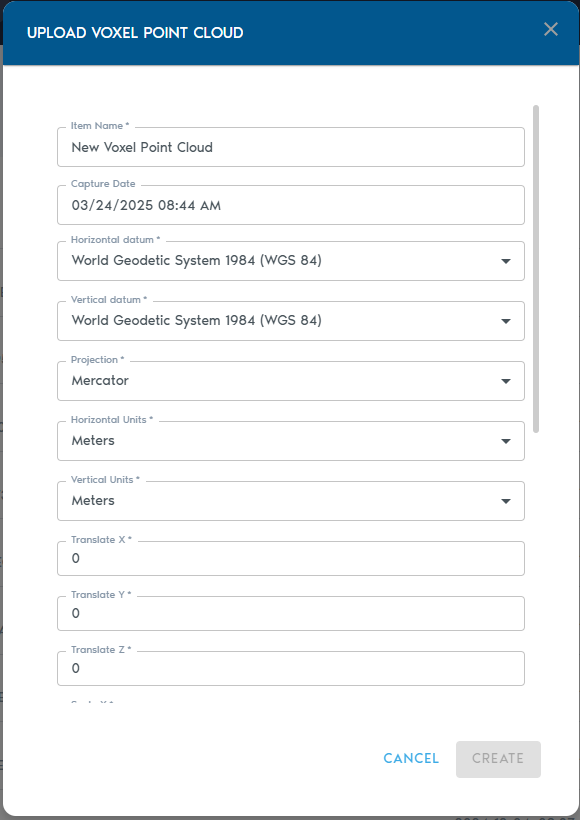
 2. Fill in the following metadata:

<table border="0" cellpadding="0" class="MsoNormalTable" id="bkmrk-field-description-%C2%A0-" style="width: 92.8571%; height: 442.126px;"><thead><tr style="height: 36.5938px;"><td style="padding: 0.75pt; width: 18.417%; height: 36.5938px;">**Field**

</td><td style="padding: 0.75pt; width: 81.583%; height: 36.5938px;">**Description**

</td></tr></thead><tbody><tr style="height: 36.5938px;"><td style="padding: 0.75pt; width: 18.417%; height: 36.5938px;">**Item Name**

</td><td style="padding: 0.75pt; width: 81.583%; height: 36.5938px;">A clear, descriptive name for the new entity.

</td></tr><tr style="height: 36.5938px;"><td style="padding: 0.75pt; width: 18.417%; height: 36.5938px;">**Capture Device**

</td><td style="padding: 0.75pt; width: 81.583%; height: 36.5938px;">*(Optional)* A label identifying the capture device (e.g., “Riegl VZ-400i”, “Mobile LiDAR”).

</td></tr><tr style="height: 36.5938px;"><td style="padding: 0.75pt; width: 18.417%; height: 36.5938px;">**Capture Date**

</td><td style="padding: 0.75pt; width: 81.583%; height: 36.5938px;">*(Optional)* The original date of data collection.

</td></tr><tr style="height: 36.5938px;"><td style="padding: 0.75pt; width: 18.417%; height: 36.5938px;">**Horizontal Datum**

</td><td style="padding: 0.75pt; width: 81.583%; height: 36.5938px;">The horizontal reference system used in the point cloud data.

</td></tr><tr style="height: 36.5938px;"><td style="padding: 0.75pt; width: 18.417%; height: 36.5938px;">**Vertical Datum**

</td><td style="padding: 0.75pt; width: 81.583%; height: 36.5938px;">The vertical reference system for elevation values.

</td></tr><tr style="height: 36.5938px;"><td style="padding: 0.75pt; width: 18.417%; height: 36.5938px;">**Projection**

</td><td style="padding: 0.75pt; width: 81.583%; height: 36.5938px;">The spatial projection used for the dataset.

</td></tr><tr style="height: 36.5938px;"><td style="padding: 0.75pt; width: 18.417%; height: 36.5938px;">**Horizontal Units**

</td><td style="padding: 0.75pt; width: 81.583%; height: 36.5938px;">Units for horizontal coordinates (e.g., meters, feet).

</td></tr><tr style="height: 36.5938px;"><td style="padding: 0.75pt; width: 18.417%; height: 36.5938px;">**Vertical Units**

</td><td style="padding: 0.75pt; width: 81.583%; height: 36.5938px;">Units for vertical coordinates.

</td></tr><tr style="height: 36.5938px;"><td style="padding: 0.75pt; width: 18.417%; height: 36.5938px;">**Translate X/Y/Z**

</td><td style="padding: 0.75pt; width: 81.583%; height: 36.5938px;">Adjusts the position of the model along each axis.

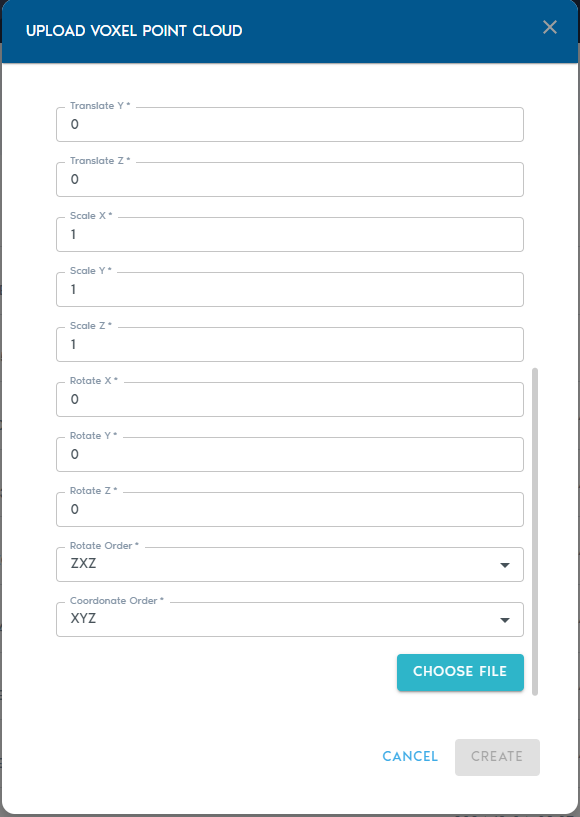
</td></tr><tr style="height: 36.5938px;"><td style="padding: 0.75pt; width: 18.417%; height: 36.5938px;">**Scale X/Y/Z**

</td><td style="padding: 0.75pt; width: 81.583%; height: 36.5938px;">Rescales the model; a value of **1.0** retains the original size.

</td></tr><tr style="height: 19.7969px;"><td style="padding: 0.75pt; width: 18.417%; height: 19.7969px;">**Rotate X/Y/Z**

</td><td style="padding: 0.75pt; width: 81.583%; height: 19.7969px;">Applies rotation (in degrees) around each axis using Euler angles.

</td></tr><tr style="height: 19.7969px;"><td style="padding: 0.75pt; width: 18.417%; height: 19.7969px;">**Rotation Order**

</td><td style="padding: 0.75pt; width: 81.583%; height: 19.7969px;">Defines the sequence in which rotations are applied (e.g., XYZ, ZYX).

</td></tr></tbody></table>

**Uploading the Data**

- Click **“Choose Files”** to upload your point cloud data.
- Each file must be a **comma-separated list of XYZ values**, where:
- The **first entry** in the file represents the location of the scanning device
- All **subsequent entries** are points captured from that location


You may select and upload **multiple files** in a single batch.

<div align="center" class="MsoNormal" id="bkmrk--2" style="text-align: center;">---

</div>**Finalizing the Upload**

Click **“Create”** to start the voxelization and upload process.  
You can monitor progress in the **“Pending”** section of the project interface.

Once complete, the voxel model will be available for viewing and integration within your project.

# Voxel Terrain (Processed)

A **Voxel Terrain** entity represents a fully volumetric terrain surface. Unlike mesh-based terrain, this format captures both surface continuity and sub-surface volume, making it ideal for detailed rendering and volumetric analysis—such as detecting changes in terrain over time.

Voxel Terrain entities can be generated from **point clouds** and **heightmaps**, and they may also include **associated Ortho-Imagery**, whether supplied by the user or auto-generated during import.

Generate continuous voxel-based terrain models from point clouds or heightmaps. Supports integration with ortho-imagery and computed normals.  
→ *Ideal for topographic visualization and volume change detection.*

<div align="center" class="MsoNormal" id="bkmrk-" style="text-align: center;">---

</div>**Creating a Voxel Terrain**

1. Navigate to your project’s **Catalog** section.
2. Click **“Add Object”** and select **“Voxel Terrain”** from the menu.

[![image.png](https://help.mystart.com/uploads/images/gallery/2025-03/scaled-1680-/2giimage.png)](https://help.mystart.com/uploads/images/gallery/2025-03/2giimage.png)

 3. Fill in the configuration fields:

<table border="0" cellpadding="0" class="MsoNormalTable" id="bkmrk-field-description-%C2%A0-" style="width: 100%; height: 188.969px;"><thead><tr style="height: 19.7969px;"><td style="padding: 0.75pt; width: 27.1577%; height: 19.7969px;">**Field**

</td><td style="padding: 0.75pt; width: 72.7232%; height: 19.7969px;">**Description**

</td></tr></thead><tbody><tr style="height: 19.7969px;"><td style="padding: 0.75pt; width: 27.1577%; height: 19.7969px;">**Item Name**

</td><td style="padding: 0.75pt; width: 72.7232%; height: 19.7969px;">A descriptive name for the new terrain entity.

</td></tr><tr style="height: 19.7969px;"><td style="padding: 0.75pt; width: 27.1577%; height: 19.7969px;">**Source**

</td><td style="padding: 0.75pt; width: 72.7232%; height: 19.7969px;">Select one or more **Point Cloud** or **Heightmap** entities to be used as the base for the terrain.

</td></tr><tr style="height: 19.7969px;"><td style="padding: 0.75pt; width: 27.1577%; height: 19.7969px;">**Include** *(Point Cloud only)*

</td><td style="padding: 0.75pt; width: 72.7232%; height: 19.7969px;">Choose which point classifications to include in the terrain model. By default, all points are used.

</td></tr><tr style="height: 36.5938px;"><td style="padding: 0.75pt; width: 27.1577%; height: 36.5938px;">**Ortho-Imagery**

</td><td style="padding: 0.75pt; width: 72.7232%; height: 36.5938px;">Select one or more **Ortho-Imagery** entities to be draped over the terrain. These can be aerial photos or computed textures.

</td></tr><tr style="height: 36.5938px;"><td style="padding: 0.75pt; width: 27.1577%; height: 36.5938px;">**Detail Recovery – Use Point Cloud Colors**

</td><td style="padding: 0.75pt; width: 72.7232%; height: 36.5938px;">If selected, the system will use RGB values from point clouds (if available) to generate an Ortho-Imagery set automatically.

</td></tr><tr style="height: 36.5938px;"><td style="padding: 0.75pt; width: 27.1577%; height: 36.5938px;">**Detail Recovery – Generate Terrain Normals**

</td><td style="padding: 0.75pt; width: 72.7232%; height: 36.5938px;">Requests the system to generate a high-frequency elevation detail set in the form of a **normal map**, enhancing terrain realism.

</td></tr></tbody></table>

**Finalizing and Viewing**

- Click **“Create”** to start the voxelization and processing workflow.
- Progress can be monitored in the project’s **“Pending”** section.

Once processing is complete:

- Click **“View”** next to the Voxel Terrain entity in the **Catalog** to open it directly.
- Alternatively, create a **View** entity and set the Voxel Terrain as its source to include it in a broader visualization.

# Voxel Block Model (Processed)

A **Voxel Block Model** is the spatially indexed version of a raw Block Model entity. Once voxelized, the block model can be visualized in 3D, dynamically queried, and integrated with other spatial datasets in the project—making it ideal for analysis, comparison, and reporting.

Voxelize a raw block model for real-time visualization, spatial querying, and data integration.  
→ *Enables advanced visual analytics and dataset fusion.*

<div align="center" class="MsoNormal" id="bkmrk-" style="text-align: center;">---

</div>**Creating a Voxel Block Model**

1. Navigate to your project’s **Catalog** section.
2. Click the **“Add Object”** button and select **“Voxel Block Model”** from the list.

<table border="1" id="bkmrk--1" style="border-collapse: collapse; width: 100%;"><colgroup><col style="width: 50%;"></col><col style="width: 50%;"></col></colgroup><tbody><tr><td>[![image.png](https://help.mystart.com/uploads/images/gallery/2025-03/scaled-1680-/uYVimage.png)](https://help.mystart.com/uploads/images/gallery/2025-03/uYVimage.png)

</td><td>[![image.png](https://help.mystart.com/uploads/images/gallery/2025-03/scaled-1680-/WYMimage.png)](https://help.mystart.com/uploads/images/gallery/2025-03/WYMimage.png)

</td></tr></tbody></table>

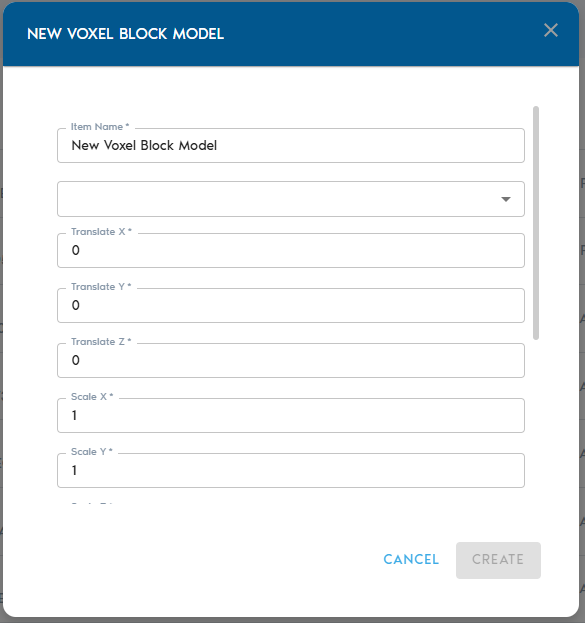
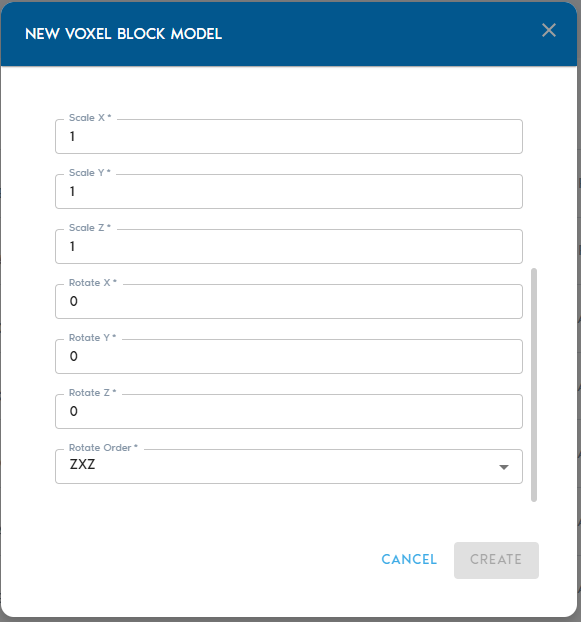
 3. Fill out the following configuration fields:

<table border="0" cellpadding="0" class="MsoNormalTable" id="bkmrk-field-description-%C2%A0-" style="width: 93.6905%; height: 188.969px;"><thead><tr style="height: 36.5938px;"><td style="padding: 0.75pt; width: 17.4927%; height: 36.5938px;">**Field**

</td><td style="padding: 0.75pt; width: 82.5073%; height: 36.5938px;">**Description**

</td></tr></thead><tbody><tr style="height: 36.5938px;"><td style="padding: 0.75pt; width: 17.4927%; height: 36.5938px;">**Item Name**

</td><td style="padding: 0.75pt; width: 82.5073%; height: 36.5938px;">A readable, descriptive name for the new voxelized block model.

</td></tr><tr style="height: 36.5938px;"><td style="padding: 0.75pt; width: 17.4927%; height: 36.5938px;">**Source**

</td><td style="padding: 0.75pt; width: 82.5073%; height: 36.5938px;">Select a raw **Block Model** entity from the list. This will be used as the input for voxelization.

</td></tr><tr style="height: 19.7969px;"><td style="padding: 0.75pt; width: 17.4927%; height: 19.7969px;">**Translate X / Y / Z**

</td><td style="padding: 0.75pt; width: 82.5073%; height: 19.7969px;">Move the model along each axis by the specified value.

</td></tr><tr style="height: 19.7969px;"><td style="padding: 0.75pt; width: 17.4927%; height: 19.7969px;">**Scale X / Y / Z**

</td><td style="padding: 0.75pt; width: 82.5073%; height: 19.7969px;">Scale the model along each axis. A value of **1.0** maintains the original size.

</td></tr><tr style="height: 19.7969px;"><td style="padding: 0.75pt; width: 17.4927%; height: 19.7969px;">**Rotate X / Y / Z**

</td><td style="padding: 0.75pt; width: 82.5073%; height: 19.7969px;">Apply **Euler rotation angles** (in degrees) around the X, Y, and Z axes.

</td></tr><tr style="height: 19.7969px;"><td style="padding: 0.75pt; width: 17.4927%; height: 19.7969px;">**Rotation Order**

</td><td style="padding: 0.75pt; width: 82.5073%; height: 19.7969px;">Specify the sequence in which rotations are applied (e.g., XYZ, ZYX).

</td></tr></tbody></table>

**Finalizing the Process**

- Once all parameters are configured, click **“Create”** to begin the voxelization process.
- You can monitor progress in the **“Pending”** section of the project dashboard.

<div align="center" class="MsoNormal" id="bkmrk--2" style="text-align: center;">---

</div>**Viewing the Voxel Block Model**

After processing is complete:

- Click the **“View”** button next to the entity in the **Catalog** to explore it in 3D.
- Alternatively, create a **View** entity and assign the voxelized block model as its source dataset for integration with other spatial layers.

# Voxel Generator

<span class="rvts6">The Voxel Generator entity is a general-purpose volumetric entity. The content of this type of entity is the output of a user-supplied program. Currently only Python programs are supported.</span>

<span class="rvts6">To create a new Voxel Generator entity, click on “Voxel Generator” from the “Add” menu. You will see the following options:</span>

![](https://demo.voxelfarm.com/help/lib/NewItem23.png)

<span class="rvts6">  
</span>

<div class="rvps2" id="bkmrk-name-a-readable-name"><table border="1" cellpadding="7" cellspacing="-1" style="height: 68px; width: 79.1667%;"><tbody><tr valign="top"><td style="width: 8.57143%;" valign="top" width="57"><span class="rvts6">Name</span>

</td><td style="width: 85.2632%;" valign="top" width="567"><span class="rvts6">A readable name for the new entity</span>

</td></tr><tr valign="top"><td style="width: 8.57143%;" valign="top" width="57"><span class="rvts6">Source</span>

</td><td style="width: 85.2632%;" valign="top" width="567"><span class="rvts6">Shows a list of available Program entities. From this list, you can select which Program will be used by Voxel Generator.</span>

</td></tr></tbody></table>

</div><span class="rvts6"> </span><span class="rvts6">Depending on which program is chosen, additional inputs may appear. The selected program may request additional information.</span>

<span class="rvts6">Click on “Create” to add the Voxel Generator to the project.</span>

<span class="rvts6">You can view the new entity by clicking on the “View” button in the entity’s row inside the Catalog section for the project. Alternatively, you may create a View entity that uses the newly created entity as a source dataset.</span>

# Program

A **Program** entity stores custom Python code within a project. These scripts allow you to automate tasks, generate volumetric data, perform spatial analysis, or control visual representations of datasets.

Add custom Python scripts that serve as generators, report engines, or view composers.  
→ *Supports automation, data extraction, and interactive visual logic.*

<div align="center" class="MsoNormal" id="bkmrk-" style="text-align: center;">---

</div>**Types of Program Entities**

There are three supported program types in VoxelSpace:

- **Voxel Generator**  
    Used to create custom volumetric objects through procedural generation. These scripts can be applied in **Voxel Generator** entities.

For more details, refer to the **Voxel Generator Programs** section.

- **Report**  
    Executes code over a defined spatial region to collect, analyze, and summarize spatial data. Ideal for inspections, calculations, and data extraction.

See the **Report Programs** section for more information.

- **View**  
    Controls how multiple datasets are rendered on screen. This allows for custom visual compositions or dynamic visual layers.

Learn more in the **View Programs** section.

<div align="center" class="MsoNormal" id="bkmrk--1" style="text-align: center;">---

</div>**Creating a Program Entity**

1. Go to your project’s **Catalog** section.
2. Click **“Add Object”** and select **“Program”** from the list.
3. Enter the following information:

<table border="0" cellpadding="0" class="MsoNormalTable" id="bkmrk-field-description-%C2%A0-" style="width: 85.9524%; height: 112px;"><thead><tr style="height: 19.7969px;"><td style="padding: 0.75pt; width: 20.1807%; height: 19.7969px;">**Field**

</td><td style="padding: 0.75pt; width: 79.8193%; height: 19.7969px;">**Description**

</td></tr></thead><tbody><tr style="height: 36.5938px;"><td style="padding: 0.75pt; width: 20.1807%; height: 36.5938px;">**Program Name**

</td><td style="padding: 0.75pt; width: 79.8193%; height: 36.5938px;">A readable, descriptive name for the program.

</td></tr><tr style="height: 19.7969px;"><td style="padding: 0.75pt; width: 20.1807%; height: 19.7969px;">**Type**

</td><td style="padding: 0.75pt; width: 79.8193%; height: 19.7969px;">Select the program type: **Voxel Generator**, **Report**, or **View**.

</td></tr><tr style="height: 36.5938px;"><td style="padding: 0.75pt; width: 20.1807%; height: 36.5938px;">**Code**

</td><td style="padding: 0.75pt; width: 79.8193%; height: 36.5938px;">Paste or write your custom Python code for the selected purpose.

</td></tr></tbody></table>

![](https://demo.voxelfarm.com/help/lib/NewItem25.png)

Once saved, your Program entity will be available for use in corresponding entity types depending on its category.

<div class="rvps2" id="bkmrk-program-name-a-reada"></div>

# View

A **View** entity stores a pre-configured visualization composed of one or more spatial datasets. Views allow team members to quickly share meaningful scenes, insights, and spatial analyses across a project.

<div align="center" class="MsoNormal" id="bkmrk-" style="text-align: center;">---

</div>**Why Use Views?**

- Share complex spatial insights in an intuitive format
- Combine multiple datasets into a single visual context
- Enable consistent visualizations across teams
- Quickly iterate and refine scenes before saving or sharing

<div align="center" class="MsoNormal" id="bkmrk--1" style="text-align: center;">---

</div>To learn how to create a new View, please refer to the <span class="MsoHyperlink">**<span style="mso-field-code: ' HYPERLINK ';">Creating a View</span>**</span> section.

# Report

A **Report** entity stores the output generated by running a custom report program across one or more spatial datasets within a defined region of a project.

<div align="center" class="MsoNormal" id="bkmrk-" style="text-align: center;">---

</div>**Key Uses for Reports:**

- Volume change calculations
- Material distribution summaries
- Geospatial audits and compliance checks
- Custom analytics over selected project regions

Each report is created by executing a Python-based **report program** against a specified region and source dataset(s).

<div align="center" class="MsoNormal" id="bkmrk--1" style="text-align: center;">---

</div>To learn how to create a new Report, please refer to the <span class="MsoHyperlink">**<span style="mso-field-code: ' HYPERLINK ';">Creating a Report</span>**</span> section.

# Data Export

The VoxelSpace platform provides a user-friendly way to export spatial data in standard formats for use outside the system. The **Export** entity is used to define and execute an export job, and it also stores the results for later download.

<div align="center" class="MsoNormal" id="bkmrk-" style="text-align: center;">---

</div>**Creating a Data Export**

1. In your project’s **Catalog**, click **“Add Object”** and select **“Voxel Generator.”** *(This is the current interface label for launching export jobs.)*

![](https://demo.voxelfarm.com/help/lib/NewItem88.png)

 3. Complete the configuration fields:

<table border="0" cellpadding="0" class="MsoNormalTable" id="bkmrk-field-description-%C2%A0-" style="width: 100%;"><thead><tr style="mso-yfti-irow: 0; mso-yfti-firstrow: yes;"><td style="padding: 0.75pt; width: 15.1403%;">**Field**

</td><td style="padding: 0.75pt; width: 84.8597%;">**Description**

</td></tr></thead><tbody><tr style="mso-yfti-irow: 1;"><td style="padding: 0.75pt; width: 15.1403%;">**File Name**

</td><td style="padding: 0.75pt; width: 84.8597%;">A readable name for the export job. This will also be used as the exported file name when downloaded.

</td></tr><tr style="mso-yfti-irow: 2;"><td style="padding: 0.75pt; width: 15.1403%;">**Region**

</td><td style="padding: 0.75pt; width: 84.8597%;">Select the region of interest from the list of available project regions. This defines the spatial area for the export.   
&gt; Refer to the **Working with Regions** section to learn how to define regions.

</td></tr><tr style="mso-yfti-irow: 3;"><td style="padding: 0.75pt; width: 15.1403%;">**Type**

</td><td style="padding: 0.75pt; width: 84.8597%;">Choose the data format for export: &lt;ul&gt;&lt;li&gt;**Mesh** – Exports surface data as an .OBJ file&lt;/li&gt;&lt;li&gt;**Points** – Exports point cloud data as a .CSV file&lt;/li&gt;&lt;li&gt;**Raster** – Exports ortho-imagery as .TIFF with accompanying .TFW (world file)&lt;/li&gt;&lt;/ul&gt;

</td></tr><tr style="mso-yfti-irow: 4;"><td style="padding: 0.75pt; width: 15.1403%;">**Resolution**

</td><td style="padding: 0.75pt; width: 84.8597%;">Choose the resolution level for the export. You may export at full (1:1) density or select a lower resolution depending on your use case.

</td></tr><tr style="mso-yfti-irow: 5; mso-yfti-lastrow: yes;"><td style="padding: 0.75pt; width: 15.1403%;">**Source**

</td><td style="padding: 0.75pt; width: 84.8597%;">Select the dataset to be exported. This option is context-sensitive and will show compatible sources based on the selected export type.

</td></tr></tbody></table>

**Running and Downloading the Export**

- Click **“Create”** to initiate the export process.
- You can monitor the export status in the project’s **“Pending”** section.
- Once processing is complete, go to the **Project Catalog** and click the **“Download”** button next to the Export entity to retrieve your data.

# Heightmap (DEM)

<span class="rvts6">A <mark data-markjs="true">heightmap</mark> entity is a special type of Ortho-Imagery set where images describe altitude instead of color. The images for these sets must be in 16bit grayscale PNG format.</span>

<span class="rvts6">Once you select <mark data-markjs="true">“Heightmap”</mark> from the “Add” menu, you will see the following options:</span>

<div class="rvps2" id="bkmrk-item-name-a-readable"><table border="1" cellpadding="7" cellspacing="-1"><tbody><tr valign="top"><td valign="top" width="132"><span class="rvts6">Item Name</span>

</td><td valign="top" width="491"><span class="rvts6">A readable name for the new entity</span>

</td></tr><tr valign="top"><td valign="top" width="132"><span class="rvts6">Minimum Height</span>

</td><td valign="top" width="491"><span class="rvts6">Elevation value for black pixels in the <mark data-markjs="true">heightmap</mark></span>

</td></tr><tr valign="top"><td valign="top" width="132"><span class="rvts6">Maximum Height</span>

</td><td valign="top" width="491"><span class="rvts6">Elevation value for white pixels in the <mark data-markjs="true">heightmap</mark></span>

</td></tr><tr valign="top"><td valign="top" width="132"><span class="rvts6">Capture Device</span>

</td><td valign="top" width="491"><span class="rvts6">An optional string to identify capture device</span>

</td></tr><tr valign="top"><td valign="top" width="132"><span class="rvts6">Capture Date</span>

</td><td valign="top" width="491"><span class="rvts6">An optional field containing the original capture date</span>

</td></tr><tr valign="top"><td valign="top" width="132"><span class="rvts6">Horizontal Datum</span>

</td><td valign="top" width="491"><span class="rvts6">The horizontal datum used in the <mark data-markjs="true">heightmap</mark></span>

</td></tr><tr valign="top"><td valign="top" width="132"><span class="rvts6">Vertical Datum</span>

</td><td valign="top" width="491"><span class="rvts6">The vertical datum used in the <mark data-markjs="true">heightmap</mark></span>

</td></tr><tr valign="top"><td valign="top" width="132"><span class="rvts6">Projection</span>

</td><td valign="top" width="491"><span class="rvts6">The projection used by the <mark data-markjs="true">heightmap</mark></span>

</td></tr><tr valign="top"><td valign="top" width="132"><span class="rvts6">Horizontal Units</span>

</td><td valign="top" width="491"><span class="rvts6">The horizontal unit type used in the <mark data-markjs="true">heightmap</mark></span>

</td></tr><tr valign="top"><td valign="top" width="132"><span class="rvts6">Vertical Units</span>

</td><td valign="top" width="491"><span class="rvts6">The vertical unit type used in the <mark data-markjs="true">heightmap</mark></span>

</td></tr></tbody></table>

</div><span class="rvts6"> </span>

<span class="rvts6">Click “Choose Files” to select which files to upload as the Ortho-Imagery set. Each image in the set is expected to have a matching world registration file. The following table lists the supported image formats and the expected world file extension for the format:</span>

<span class="rvts6">  
</span>

<div class="rvps2" id="bkmrk-image-format-extensi"><table border="1" cellpadding="7" cellspacing="-1" width="359"><tbody><tr valign="top"><td valign="top" width="170"><span class="rvts6">Image Format Extension</span>

</td><td valign="top" width="189"><span class="rvts6">Expected World File Extension</span>

</td></tr><tr valign="top"><td valign="top" width="170"><span class="rvts6">.PNG (16bit grayscale)</span>

</td><td valign="top" width="189"><span class="rvts6">.PGW</span>

</td></tr></tbody></table>

</div><span class="rvts6"> </span>

<span class="rvts6">You can also select multiple archive ZIP files, which should contain the image and matching world registration files.</span>

<span class="rvts6">Click on “Create” to begin the upload process. You can track the upload operation from the “Pending” section in the project’s page.</span>

# Working with Views

**Views** are one of the core tools in VoxelSpace, allowing users to interact with spatial datasets in an immersive 3D environment. Whether you're exploring raw data, comparing models, or creating polished visualizations for reporting, Views make it easy to visualize and share spatial insights.

Views can be customized, saved, and shared with your team for consistent and collaborative access across a project.

# Introduction

**Views** in VoxelSpace are pre-configured visual compositions of multiple spatial datasets. They provide a fast, effective way for teams to explore, analyze, and share complex geospatial information.

A View can function as a **carefully curated scene**, set up by one team member for others to review and interact with. Alternatively, Views can be used as **temporary workspaces**—perfect for quick experimentation by combining different datasets on the fly.

<div align="center" class="MsoNormal" id="bkmrk-" style="text-align: center;">---

</div>**Accessing Views in a Project**

Each project contains a list of Views that are accessible via the **“Views”** tab in the Project Page.

[![image.png](https://help.mystart.com/uploads/images/gallery/2025-03/scaled-1680-/8n5image.png)](https://help.mystart.com/uploads/images/gallery/2025-03/8n5image.png)

From this section, users can:

- Click on a **View card** to open an existing View
- Click the **“Add View”** button to create a new one

*(See the <span class="MsoHyperlink"><span style="mso-field-code: ' HYPERLINK ';">Creating a View</span></span> section for detailed instructions.)*

When a View is opened, it loads in VoxelSpace’s native **OpenGL viewer**, allowing full 3D interaction with the visualized data.

[![image.png](https://help.mystart.com/uploads/images/gallery/2025-03/scaled-1680-/hlnimage.png)](https://help.mystart.com/uploads/images/gallery/2025-03/hlnimage.png)

**Viewer Controls**

Use the following mouse controls to interact with the 3D scene:

<table border="0" cellpadding="0" class="MsoNormalTable" id="bkmrk-control-action-%C2%A0-lef" style="height: 112.781px; width: 69.2857%;"><thead><tr style="height: 36.5938px;"><td style="padding: 0.75pt; width: 32.5613%; height: 36.5938px;">**Control**

</td><td style="padding: 0.75pt; width: 67.4414%; height: 36.5938px;">**Action**

</td></tr></thead><tbody><tr style="height: 36.5938px;"><td style="padding: 0.75pt; width: 32.5613%; height: 36.5938px;">**Left Mouse Button**

</td><td style="padding: 0.75pt; width: 67.4414%; height: 36.5938px;">Rotate the camera around the focus point

</td></tr><tr style="height: 19.7969px;"><td style="padding: 0.75pt; width: 32.5613%; height: 19.7969px;">**Right Mouse Button**

</td><td style="padding: 0.75pt; width: 67.4414%; height: 19.7969px;">Pan the camera across the horizontal plane

</td></tr><tr style="height: 19.7969px;"><td style="padding: 0.75pt; width: 32.5613%; height: 19.7969px;">**Mouse Wheel**

</td><td style="padding: 0.75pt; width: 67.4414%; height: 19.7969px;">Zoom in and out

</td></tr></tbody></table>

<div class="rvps2" id="bkmrk-left-mouse-button-ro"></div>

# Creating a View

The VoxelSpace WebUI provides two ways to begin creating a **View**, allowing users to define how multiple spatial datasets are visualized together.

<div align="center" class="MsoNormal" id="bkmrk-" style="text-align: center;">---

</div>**Starting a New View**

You can initiate View creation in either of the following ways:

**1. From the Catalog Section**  
Click **“Add Object”**, then select **“View.”** This method lets you explicitly choose the **Folder** where the View will be stored.

[![image.png](https://help.mystart.com/uploads/images/gallery/2025-03/scaled-1680-/pzbimage.png)](https://help.mystart.com/uploads/images/gallery/2025-03/pzbimage.png)

**2. From the Views Section**  
On the **Project’s View tab**, click the **“Create View”** button.

[![image.png](https://help.mystart.com/uploads/images/gallery/2025-03/scaled-1680-/gAZimage.png)](https://help.mystart.com/uploads/images/gallery/2025-03/gAZimage.png)

Both methods open the same configuration interface. When using the second method, you can assign a folder from within the **View Definition** dialog.

[![image.png](https://help.mystart.com/uploads/images/gallery/2025-03/scaled-1680-/hJfimage.png)](https://help.mystart.com/uploads/images/gallery/2025-03/hJfimage.png)

<span class="rvts6">Both approaches have the same results, the only difference is in the first case the user is aware from the start of which Folder will contain the View object, as the object is explicitly added to a Folder. When using the second approach, it is also possible to define which Folder will contain the View entity from the View definition UI.</span>

<span class="rvts6">Using on any of the approaches above will show the View creation UI:</span>

[![image.png](https://help.mystart.com/uploads/images/gallery/2025-03/scaled-1680-/pPeimage.png)](https://help.mystart.com/uploads/images/gallery/2025-03/pPeimage.png)

<span class="rvts6">At this point the View is created, but not saved into the Project. Other team members will not see it until you press the "Save" button. At the top-right corner of the UI, a button with a gear icon displays the View configuration options.</span>

<span class="rvts6">Typically, you will add one or more visual layers to the View before saving it. The [Adding Layers to a View](https://help.mystart.com/books/using-the-webui/page/adding-layers-to-a-view "Adding Layers to a View")</span><span class="rvts6"> section covers how to add layers of data to a View.</span>

<span class="rvts6">Once the view displays some content, you can provide a meaningful name to it and capture its thumbnail from the "General" section found in the View configuration panel:</span>

<span class="rvts6">It is possible to save your changes to the view by clicking any of the "Save" buttons in the View configuration panel. One is found in the "General" section and the second is in the "Layers" section.</span>

# Adding Layers to a View

In VoxelSpace, a **View** can contain one or more **visual layers**, each representing a different dataset or spatial element. Layers are essential for building rich, multi-dimensional visualizations that combine terrain, point clouds, block models, and more.

<div align="center" class="MsoNormal" id="bkmrk-" style="text-align: center;">---

</div>**How to Add a Layer**

<span class="rvts6"><span style="font-size: 11.0pt; line-height: 107%; font-family: 'Aptos',sans-serif; mso-ascii-theme-font: minor-latin; mso-fareast-font-family: Aptos; mso-fareast-theme-font: minor-latin; mso-hansi-theme-font: minor-latin; mso-bidi-font-family: 'Times New Roman'; mso-bidi-theme-font: minor-bidi; mso-ansi-language: EN-CA; mso-fareast-language: EN-US; mso-bidi-language: AR-SA;">1. While in the **View interface**, click the **Layer icon**</span> </span>[![image.png](https://help.mystart.com/uploads/images/gallery/2025-03/scaled-1680-/oQKimage.png)](https://help.mystart.com/uploads/images/gallery/2025-03/oQKimage.png) to open the **View Configuration Panel**.

2\. In the panel, select the **“Layers”** tab.

<span style="font-size: 11.0pt; line-height: 107%; font-family: 'Aptos',sans-serif; mso-ascii-theme-font: minor-latin; mso-fareast-font-family: Aptos; mso-fareast-theme-font: minor-latin; mso-hansi-theme-font: minor-latin; mso-bidi-font-family: 'Times New Roman'; mso-bidi-theme-font: minor-bidi; mso-ansi-language: EN-CA; mso-fareast-language: EN-US; mso-bidi-language: AR-SA;">3. Click the **“Add Layer…”** button to begin adding data to the View.</span>

[![image.png](https://help.mystart.com/uploads/images/gallery/2025-03/scaled-1680-/mNJimage.png)](https://help.mystart.com/uploads/images/gallery/2025-03/mNJimage.png)

**What Happens Next?**

After clicking **“Add Layer…”**, you’ll be prompted to:

- **Select a dataset** from the project’s catalog
- **Configure how it’s rendered**, including visibility, transparency, color maps, or display filters—depending on the dataset type

Each dataset you add enhances the View, allowing for layered analysis and deeper spatial understanding.

# Working with Cross-sections

The **View interface** in VoxelSpace allows users to perform real-time cross-section operations across spatial datasets. This tool is ideal for analyzing subsurface structures, internal geometries, or layered data distributions.

<div align="center" class="MsoNormal" id="bkmrk-" style="text-align: center;">---

</div>**Accessing Cross-Section Tools**

1. While viewing a dataset, open the **Viewer Tools panel**.
2. Click on the **“Cross-section”** option to activate the cross-section controls.

[![image.png](https://help.mystart.com/uploads/images/gallery/2025-03/scaled-1680-/JDLimage.png)](https://help.mystart.com/uploads/images/gallery/2025-03/JDLimage.png)

**Selecting Cross-Section Types**

Once the tool is enabled, you can choose from various **cross-section types** to define how the cut will interact with the 3D scene. These options typically include:

- **Single plane** – Cuts through the model along one axis
- **Box clip** – Isolates a defined volume within a bounding box
- **Axis-aligned slices** – Slices perpendicular to X, Y, or Z for sectional analysis
- *(Insert specific options from UI if applicable)*

<div align="center" class="MsoNormal" id="bkmrk--2" style="text-align: center;">---

</div>Cross-sections can be adjusted in real time—move, rotate, or scale the clipping planes to refine your view and focus on specific features of interest.

<span class="rvts6">  
</span>

<div class="rvps2" id="bkmrk-none-disables-and-hi"></div>

# Working with Regions

<span class="rvts6">A region is a spatial object that defines a volume of space. Regions are useful to provide a scope to reports, export operations and processing of spatial data in general.</span>

<span class="rvts6">The platform currently supports one type of region, which is an extruded convex N-gon.</span>

<span class="rvts6">It is possible to store multiple regions in a Project. The View configuration panel provides access to the regions in the Project. To access them, select the "Region" tab:</span>

![](https://demo.voxelfarm.com/help/lib/NewItem31.png)

<span class="rvts6">The UI exposes a set of actions that can be performed over the multiple regions in the Project:</span>

<span class="rvts6">  
</span>

<div class="rvps2" id="bkmrk-new-region-starts-a-"><table border="1" cellpadding="7" cellspacing="-1"><tbody><tr valign="top"><td valign="top" width="132"><span class="rvts6">New Region</span>

</td><td valign="top" width="491"><span class="rvts6">Starts a new region and displays it in the viewer</span>

</td></tr><tr valign="top"><td valign="top" width="132"><span class="rvts6">Load Region</span>

</td><td valign="top" width="491"><span class="rvts6">Loads a previously saved region and displays it in the viewer</span>

</td></tr><tr valign="top"><td valign="top" width="132"><span class="rvts6">Save Region</span>

</td><td valign="top" width="491"><span class="rvts6">Saves the current region</span>

</td></tr><tr valign="top"><td valign="top" width="132"><span class="rvts6">Hide Region</span>

</td><td valign="top" width="491"><span class="rvts6">Hides the current region in the viewer</span>

</td></tr><tr valign="top"><td valign="top" width="132"><span class="rvts6">Show Last Region</span>

</td><td valign="top" width="491"><span class="rvts6">Shows the last active region in the viewer</span>

</td></tr><tr valign="top"><td valign="top" width="132"><span class="rvts6">Rename Region</span>

</td><td valign="top" width="491"><span class="rvts6">Renames a region</span>

</td></tr><tr valign="top"><td valign="top" width="132"><span class="rvts6">Delete Region</span>

</td><td valign="top" width="491"><span class="rvts6">Deletes a region</span>

</td></tr><tr valign="top"><td valign="top" width="132"><span class="rvts6">Region Properties</span>

</td><td valign="top" width="491"><span class="rvts6">Shows a modal dialog that contains information about the region</span>

</td></tr></tbody></table>

</div>

# Creating URL links to Views

<span class="rvts6">It is possible to create a deep link to a View in the platform. To do so, select the "General" tab in the View configuration panel. Click on the "Create Link to View..." button:</span>

![](https://demo.voxelfarm.com/help/lib/NewItem97.png)

<span class="rvts6">This will open a modal dialog containing the link. This link will bring the browser to the same View and camera position as when the link was captured. </span>

<span class="rvts6">User security will be applied to links, please make sure the recipient of the link has access to the Project.</span>

# Working with Reports

# Introduction

<span class="rvts6">The Voxel Farm platform features a spatial reporting system. This system allows to run a custom program, a report, across a large scope of space. As the program goes over space, it can analyze different layers of spatial data and perform useful computations or discoveries with the data.</span>

<span class="rvts6">Even if the report code is deceptively simple and serial, the platform is able to execute reports in a massively parallel fashion. This is achieved by running many instances of the same report program in parallel, each one looking at a different region of space. The platform integrates the results produced by the swarm of reporting nodes into a single, coherent result set.</span>

<span class="rvts6">This section covers how to run existing Report programs. To see how to create new Report programs, please visit the Report Program</span><span class="rvts6"> section of the Developer manual.</span>

# Viewing Reports

<span class="rvts6">The WebUI keeps track of all Report entities in the Project's Catalog and provides a dedicated section in the UI to access them. To access the reports, select the "Reports" section in the WebUI:</span>

![](https://demo.voxelfarm.com/help/lib/NewItem98.png)

<span class="rvts6">The reports are organized using the same hiearchy of Folders in the Project.</span>

<span class="rvts6">To view a Report, click on its name on the Tree View. The Report results will show as a table in the right panel.</span>

<span class="rvts6">Use the "Download CSV" link to download a CVS file with the results of the Report.</span>

# Creating a Report

<span class="rvts6">To create a new Report entity, go to the Project Catalog, browse to the Folder that you want to contain the Report, and click on the "Add" button.</span>

<span class="rvts6">This will display a list of Entities to add. Chose "Report" from the list:</span>

![](https://demo.voxelfarm.com/help/lib/NewItem99.png)

<span class="rvts6">This will display a modal dialog prompting for information about the report:</span>

![](https://demo.voxelfarm.com/help/lib/NewItem111.png)

<span class="rvts6">  
</span>

<div class="rvps2" id="bkmrk-name-provide-a-name-"><table border="1" cellpadding="7" cellspacing="-1"><tbody><tr valign="top"><td valign="top" width="132"><span class="rvts6">Name</span>

</td><td valign="top" width="491"><span class="rvts6">Provide a name for the report</span>

</td></tr><tr valign="top"><td valign="top" width="132"><span class="rvts6">Region</span>

</td><td valign="top" width="491"><span class="rvts6">Select one of the regions available in the Project as the scope where the Report will run. Visit the </span>[Working with Regions](https://demo.voxelfarm.com/help/WorkingwithRegions.html)<span class="rvts6"> section to see how to define a new region.</span>

</td></tr><tr valign="top"><td valign="top" width="132"><span class="rvts6">Resolution</span>

</td><td valign="top" width="491"><span class="rvts6">Allows to select the voxel resolution that will be used to compute the Report.</span>

</td></tr><tr valign="top"><td valign="top" width="132"><span class="rvts6">Program</span>

</td><td valign="top" width="491"><span class="rvts6">Select which Report Program will be used to compute the Report. For more about these special programs, see the </span>[Report Programs](https://demo.voxelfarm.com/help/ReportPrograms.html)<span class="rvts6"> section.</span>

<span class="rvts6">  
</span>

<span class="rvts6">Based on the input expected by the program, the dialog will contain other custom input fields.</span>

</td></tr></tbody></table>

</div><span class="rvts6">Click on the "Create" button to start the Report. While it is computed, the Report will appear list in the "Pending" section of the Project.</span>

<span class="rvts6">Once the report completes, it will become accessible for viewing and downloading.</span>