Working with Views
Views are one of the core tools in VoxelSpace, allowing users to interact with spatial datasets in an immersive 3D environment. Whether you're exploring raw data, comparing models, or creating polished visualizations for reporting, Views make it easy to visualize and share spatial insights.
Views can be customized, saved, and shared with your team for consistent and collaborative access across a project.
Introduction
Views in VoxelSpace are pre-configured visual compositions of multiple spatial datasets. They provide a fast, effective way for teams to explore, analyze, and share complex geospatial information.
A View can function as a carefully curated scene, set up by one team member for others to review and interact with. Alternatively, Views can be used as temporary workspaces—perfect for quick experimentation by combining different datasets on the fly.
Accessing Views in a Project
Each project contains a list of Views that are accessible via the “Views” tab in the Project Page.
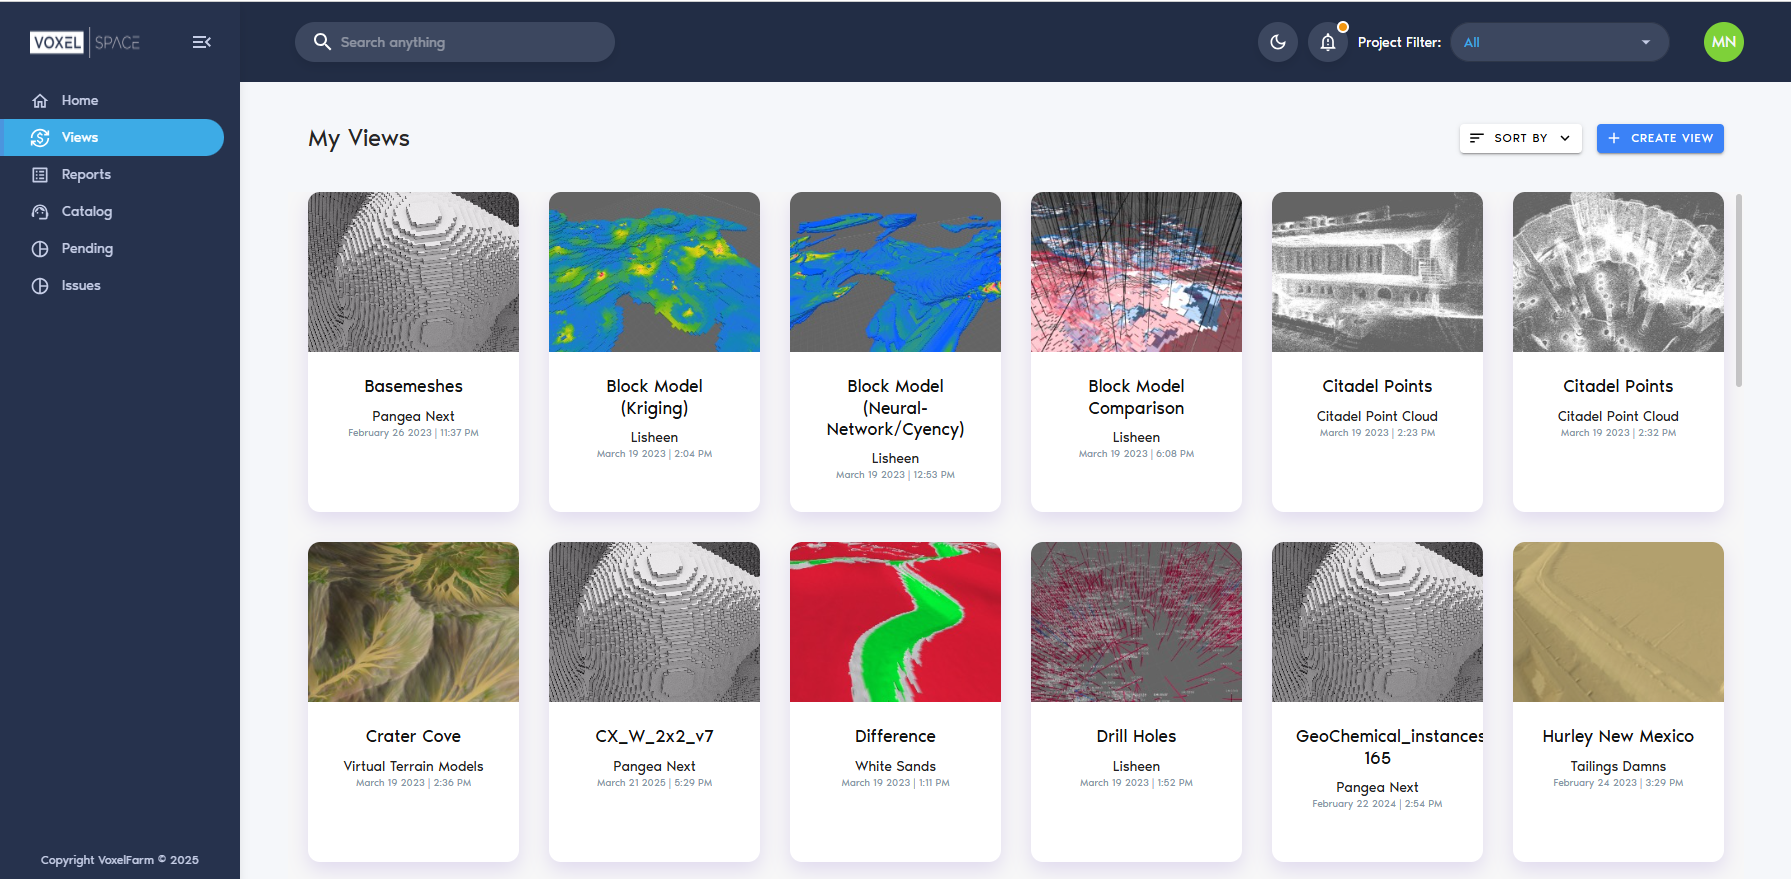
From this section, users can:
- Click on a View card to open an existing View
- Click the “Add View” button to create a new one
(See the Creating a View section for detailed instructions.)
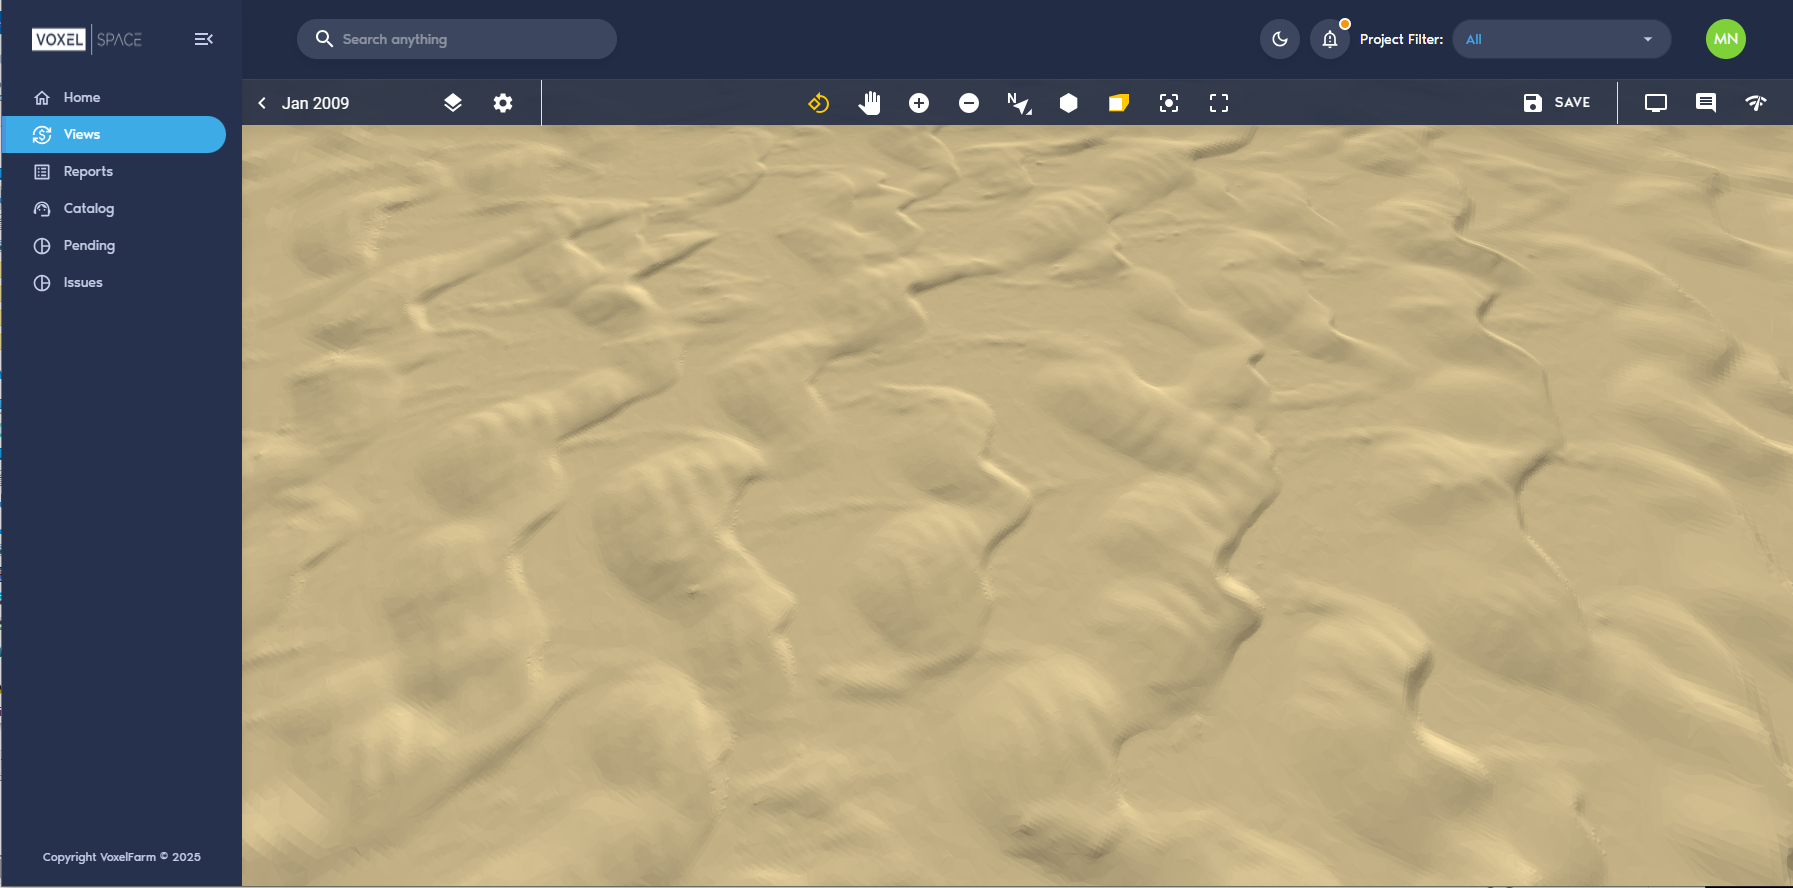
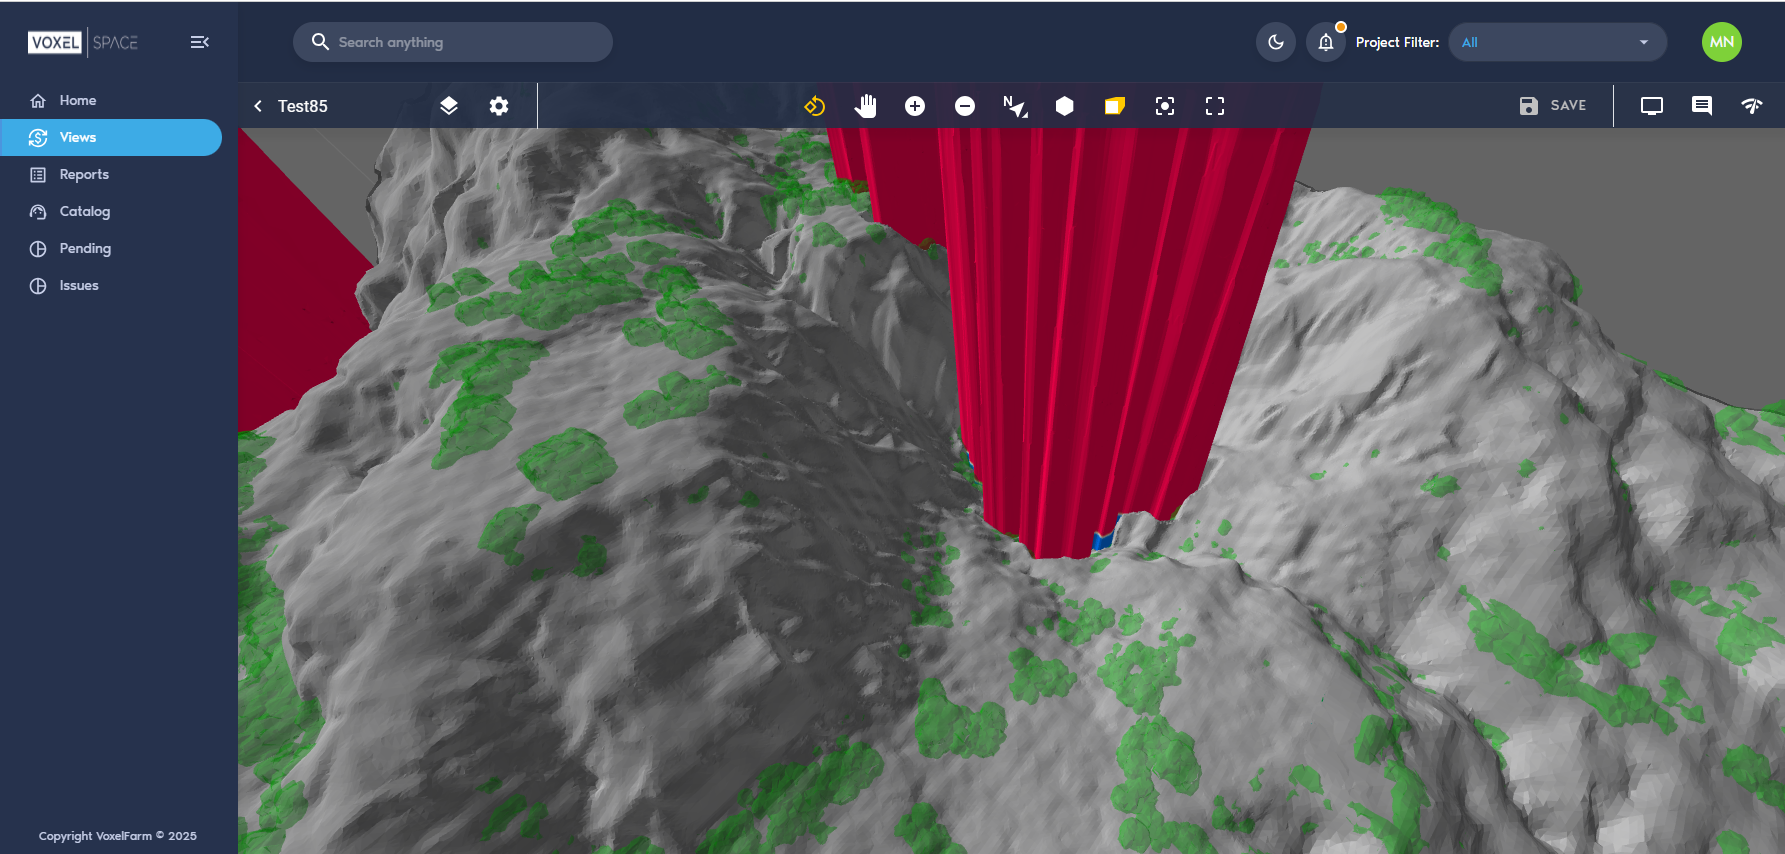
When a View is opened, it loads in VoxelSpace’s native OpenGL viewer, allowing full 3D interaction with the visualized data.
Viewer Controls
Use the following mouse controls to interact with the 3D scene:
|
Control |
Action
|
|
Left Mouse Button |
Rotate the camera around the focus point
|
|
Right Mouse Button |
Pan the camera across the horizontal plane
|
|
Mouse Wheel |
Zoom in and out |
Creating a View
The VoxelSpace WebUI provides two ways to begin creating a View, allowing users to define how multiple spatial datasets are visualized together.
Starting a New View
You can initiate View creation in either of the following ways:
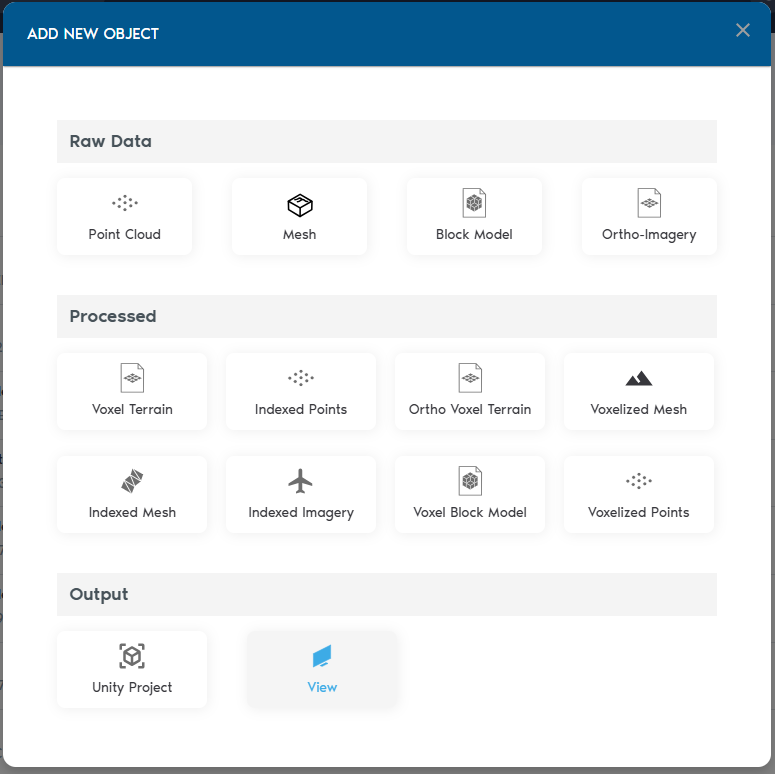
1. From the Catalog Section
Click “Add Object”, then select “View.” This method lets you explicitly choose the Folder where the View will be stored.
2. From the Views Section
On the Project’s View tab, click the “Create View” button.
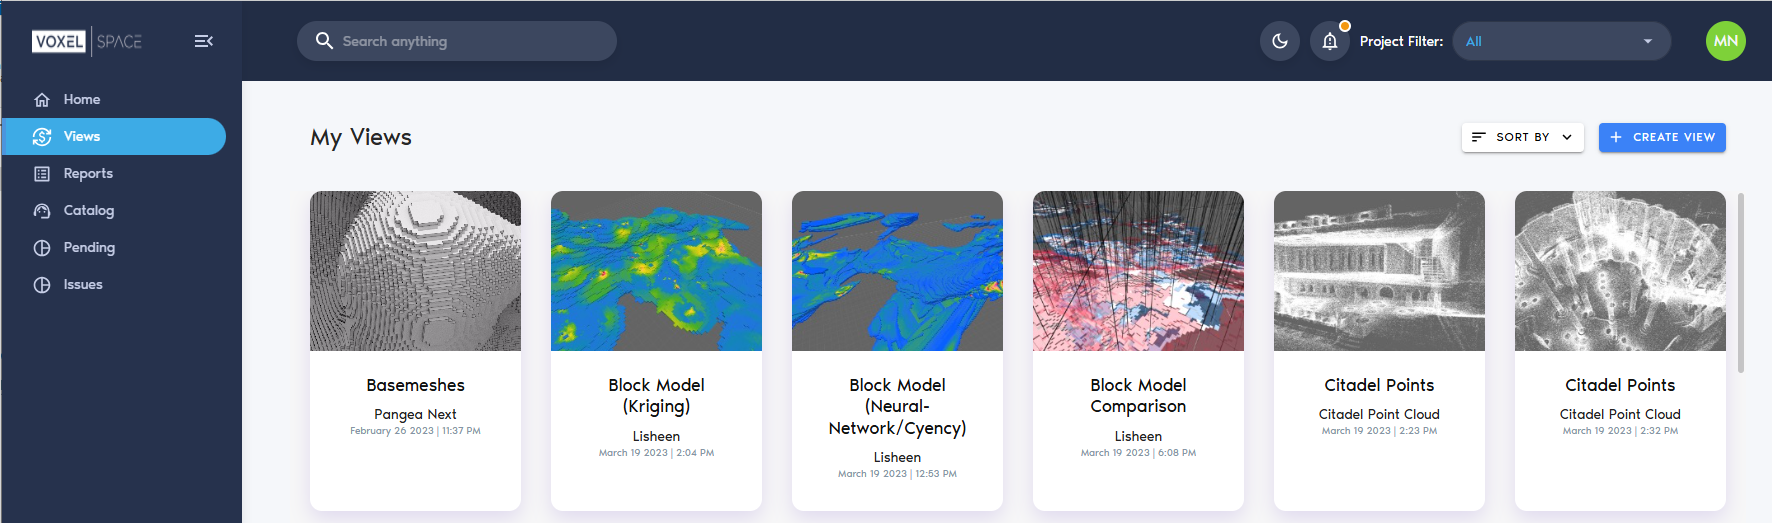
Both methods open the same configuration interface. When using the second method, you can assign a folder from within the View Definition dialog.
Both approaches have the same results, the only difference is in the first case the user is aware from the start of which Folder will contain the View object, as the object is explicitly added to a Folder. When using the second approach, it is also possible to define which Folder will contain the View entity from the View definition UI.
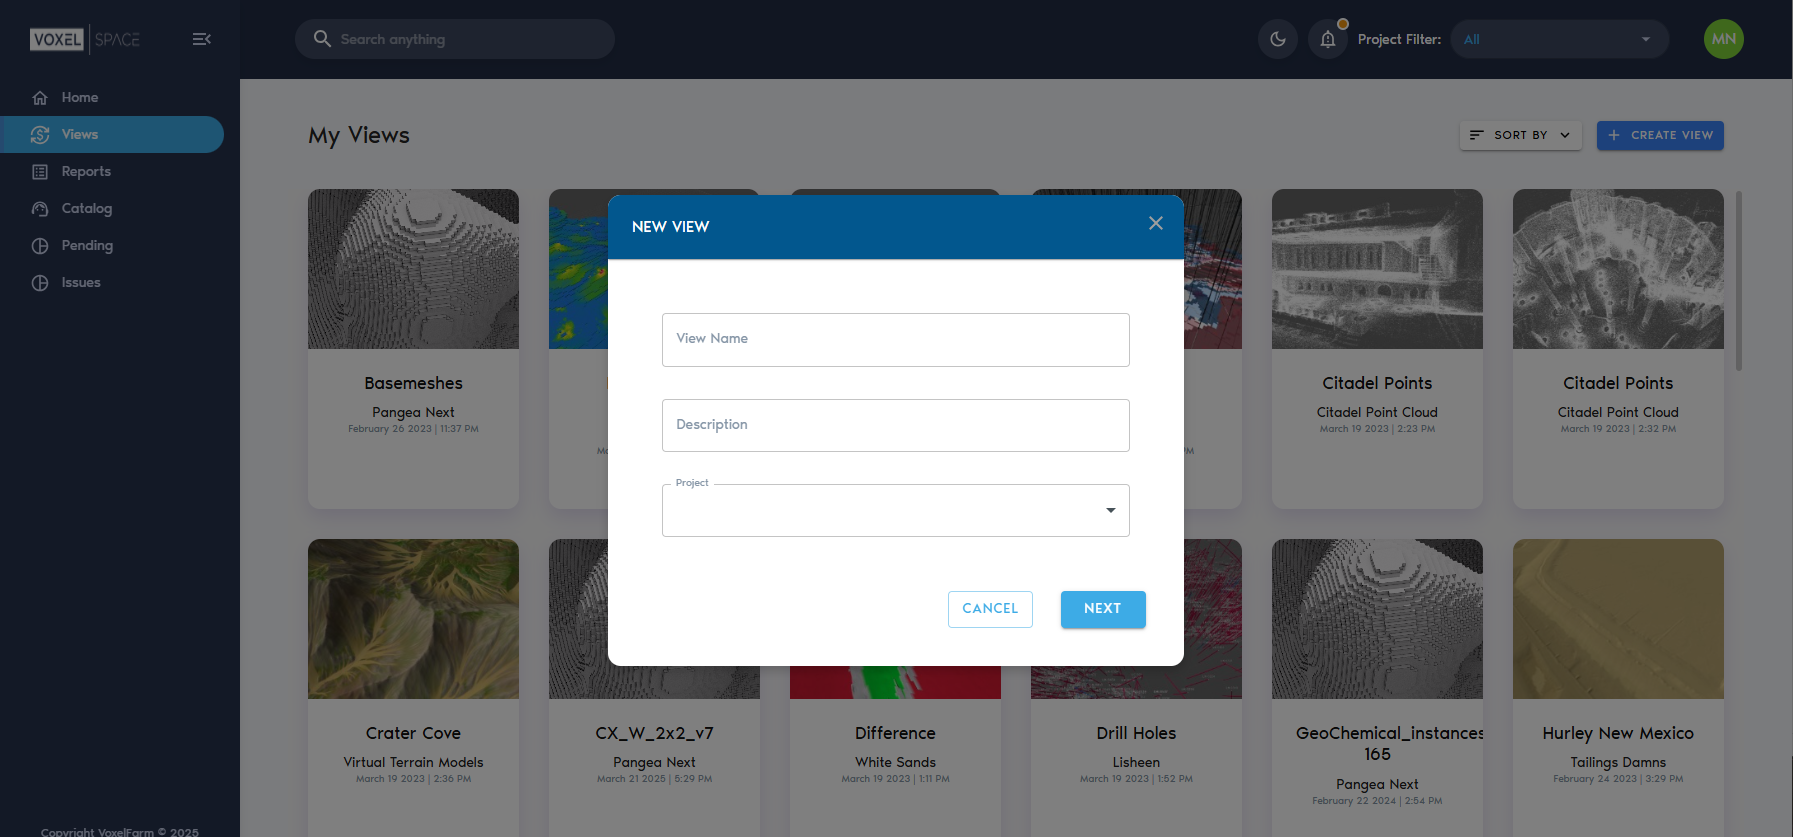
Using on any of the approaches above will show the View creation UI:
At this point the View is created, but not saved into the Project. Other team members will not see it until you press the "Save" button. At the top-right corner of the UI, a button with a gear icon displays the View configuration options.
Typically, you will add one or more visual layers to the View before saving it. The Adding Layers to a View section covers how to add layers of data to a View.
Once the view displays some content, you can provide a meaningful name to it and capture its thumbnail from the "General" section found in the View configuration panel:
It is possible to save your changes to the view by clicking any of the "Save" buttons in the View configuration panel. One is found in the "General" section and the second is in the "Layers" section.
Adding Layers to a View
In VoxelSpace, a View can contain one or more visual layers, each representing a different dataset or spatial element. Layers are essential for building rich, multi-dimensional visualizations that combine terrain, point clouds, block models, and more.
How to Add a Layer
1. While in the View interface, click the Layer icon ![]() to open the View Configuration Panel.
to open the View Configuration Panel.
2. In the panel, select the “Layers” tab.
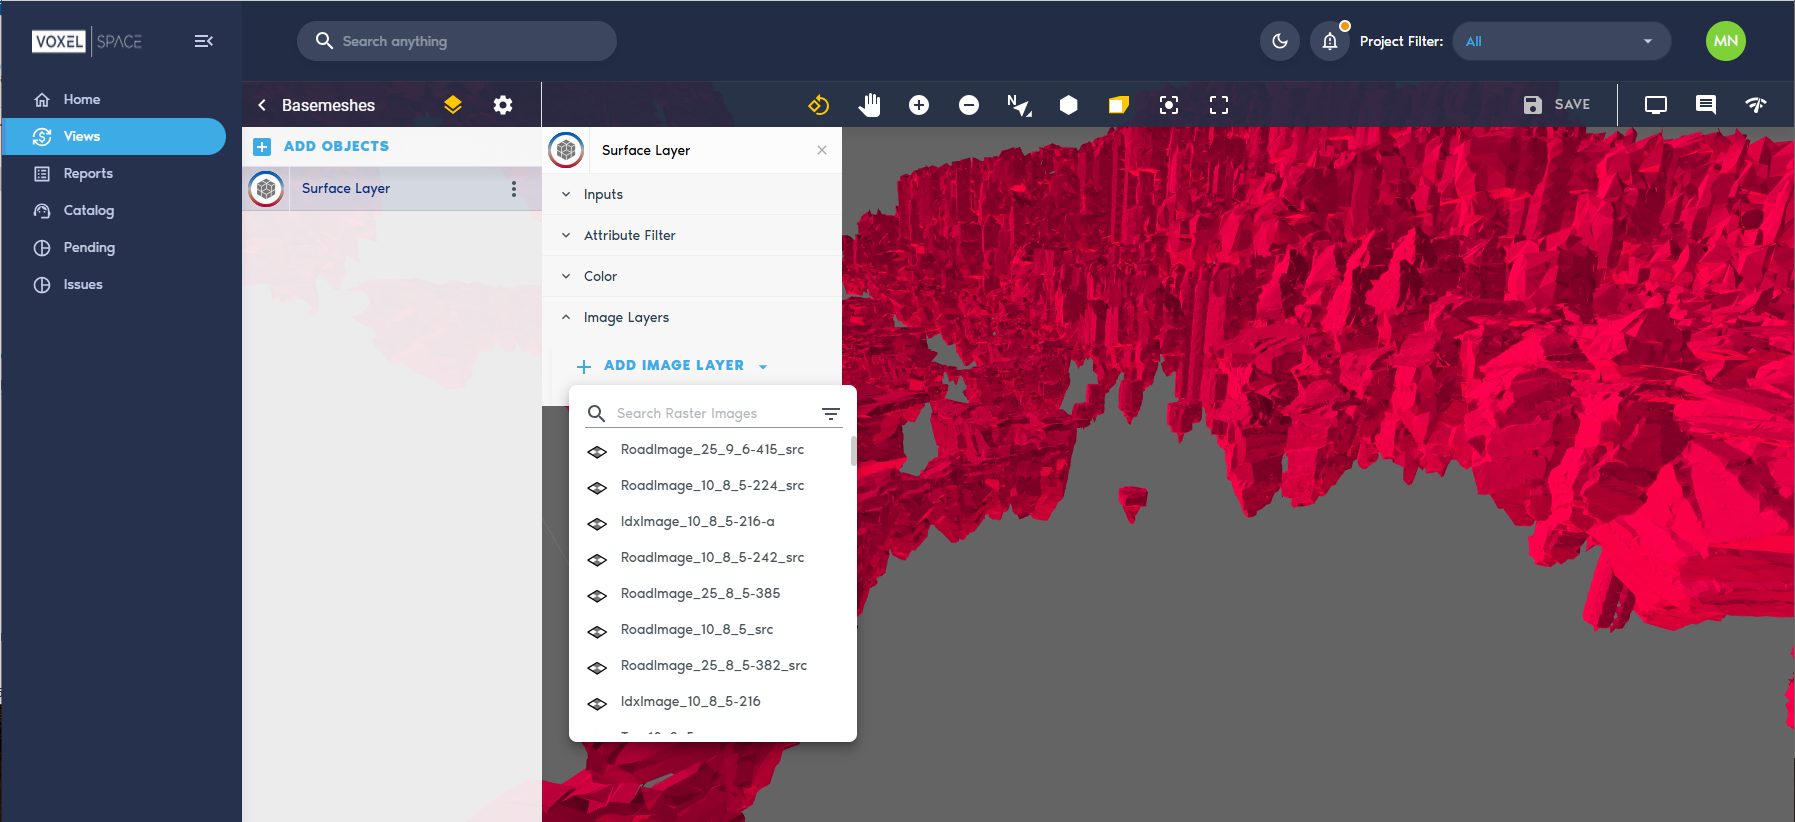
3. Click the “Add Layer…” button to begin adding data to the View.
What Happens Next?
After clicking “Add Layer…”, you’ll be prompted to:
- Select a dataset from the project’s catalog
- Configure how it’s rendered, including visibility, transparency, color maps, or display filters—depending on the dataset type
Each dataset you add enhances the View, allowing for layered analysis and deeper spatial understanding.
Working with Cross-sections
The View interface in VoxelSpace allows users to perform real-time cross-section operations across spatial datasets. This tool is ideal for analyzing subsurface structures, internal geometries, or layered data distributions.
Accessing Cross-Section Tools
- While viewing a dataset, open the Viewer Tools panel.
- Click on the “Cross-section” option to activate the cross-section controls.
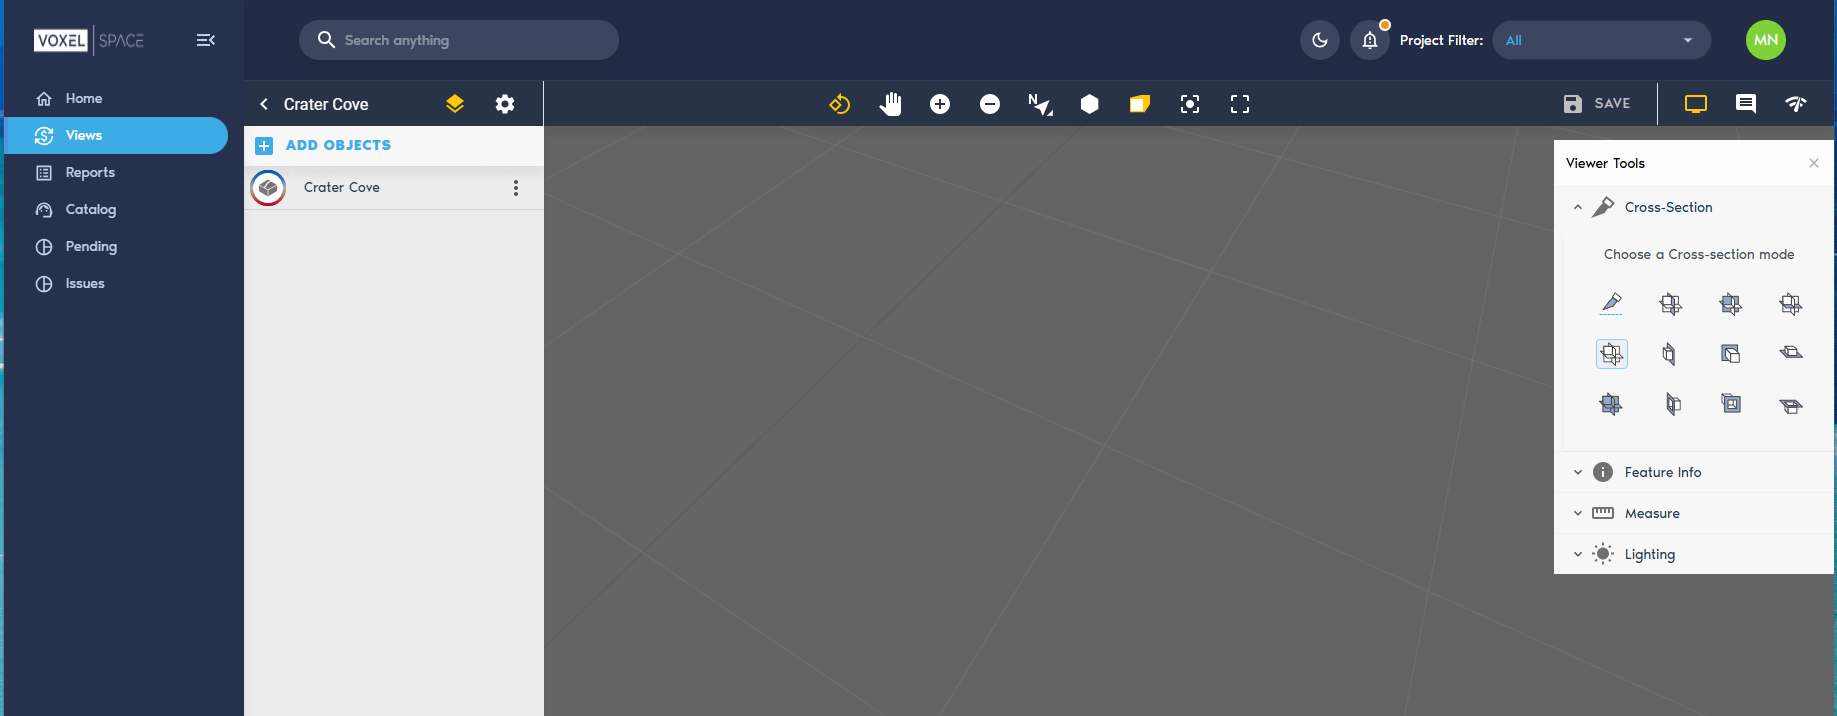
Selecting Cross-Section Types
Once the tool is enabled, you can choose from various cross-section types to define how the cut will interact with the 3D scene. These options typically include:
- Single plane – Cuts through the model along one axis
- Box clip – Isolates a defined volume within a bounding box
- Axis-aligned slices – Slices perpendicular to X, Y, or Z for sectional analysis
- (Insert specific options from UI if applicable)
Cross-sections can be adjusted in real time—move, rotate, or scale the clipping planes to refine your view and focus on specific features of interest.